
CHARACTERISTICS OF LOCAL PUMP SCHEMES REUSING DRAINAGE WATER IN A MAJOR RICE-BASED IRRIGATION AND DRAINAGE AREA IN THE RED RIVER BASIN, VIETNAM
Journal: Water Conservation and Management (WCM)
Author: Le Van Chinh, Jens Raunsø Jensen
Print ISSN : 2523-5664
Online ISSN : 2523-5672
This is an open access article distributed under the Creative Commons Attribution License CC BY 4.0, which permits unrestricted use, distribution, and reproduction in any medium, provided the original work is properly cited
Doi: 10.26480/wcm.01.2023.36.44
Abstract
 A comprehensive study was undertaken in a major rice-based irrigation and drainage area, with the objective of assessing the characteristics and importance of the wide-spread use of drainage water from canal irrigation schemes by local schemes. The irrigated area of 18,308 ha consisted of the public managed Cau Son canal scheme and 208 electric-powered pump schemes, of which 109 were classified as drainage reuse schemes using drainage water from the canal scheme. The reuse pump schemes covered 27% of the irrigated area, including 6 public and 103 local managed pump stations, the latter with about 21,000 households engaged in reuse irrigation. The local schemes were typically 25 years old and showed a high degree of variability in irrigated area, total dynamic head, design capacity, and energy use. The seasonal irrigation delivery ranged by a factor 10 with about 65% “lost” in return flow mostly as surface drainage. The use of electric power was excessive, associated with low pumping and irrigation efficiencies related to poor maintenance, inadequate water management and capacity overdesign. A significant scope was identified for improved use of water and energy and for integrating local reuse schemes in performance evaluations and water management frameworks in canal-irrigated areas.
Keywords
drainage reuse, return flow, rice, pump irrigation, water balance.
1. Introduction
1.1 Background
Irrigated lowland rice covers about 30% of the world’s irrigated area but receives about 40% of the global irrigation water, equivalent to 25% of the total freshwater withdrawals (Bouman et al., 2007). The disproportionate high application rates of water for wetland rice ranges from about 400 mm in heavy clay soils with shallow groundwater table to more than 2000 mm in coarse textured soils with deep groundwater table (Bouman and Tuong, 2001). However, only a minor fraction of the applied water is typically depleted by evapotranspiration at the field level, and the excess water may be stored in the irrigation system or leaves the system as surface and subsurface return flows, potentially available for reuse elsewhere. A global average reuse rate of 25% has been suggested (Bouman et al., 2007). A group of researchers recently reviewed water reuse in river basins in the context of recoverable flows with an emphasis on reuse indicators (Simons et al., 2015).
In many irrigated areas, a main canal irrigation scheme provides surface and subsurface return flow potentially available for reuse. The reuse may be based on pumping from shallow groundwater or open drains, diversion of surface drainage, or sub-surface lateral inflow or capillary rise to the root zone (Barnes, 2014; Hafeez et al., 2007; Hama et al., 2010; Matsuno et al., 2003; Zulu et al., 1996). Although the reuse typology is not well established, reuse is generally considered internal, when return flow is intercepted and used within the irrigation system being the source of that return flow, and external when return flow is reused downstream of the source scheme. Furthermore, reuse can be practiced “unofficially” by e.g. individual farmers at farm level (e.g. or as “official” and planned activities at the irrigation scheme, catchment or regional levels (Le and Jensen, 2014). Previous studies on reuse have mostly been concerned with water quality issues (wastewater and salinity), often aggregated at higher scheme levels. The focus of the present study is on the energy and water use characteristics of the individual reuse schemes present in a major reuse area.
In Vietnam, drainage water reuse especially by pump schemes is generally known to be very significant in the larger river basins with rice-based irrigation schemes, in particular in the spring crop season when water sources for irrigation may be scarce due to low rainfall (MARD, 2004). Reuse in the Red River Basin, which often combines different sources of return flow, was mentioned and discussed as an important solution for improved water management in irrigation systems and for sustainable water resources development in the Red River Basin (ADB, 2009; Biltonen et al., 2003). More recently, the Gov. of Vietnam has explicitly recognized the importance of drainage water reuse and encouraged drainage reuse in irrigation and drainage schemes by the Decree 54 (GoVN, 2015). However, previous studies on reuse in Vietnam have emphasized on wastewater reuse and little if any documented information is available on the reuse of irrigation return flow and on the hydraulic and water use characteristics of the drainage reuse pump schemes (e.g., Raschid-Sally et al., 2001). In practice, assessment of the return flow from irrigated agriculture is based on a rule of thumb estimation as about 20-25% of the crop water requirement (Tinh et al., 1999).
1.2 Objective
Integrated water management in catchments with drainage water reuse requires a knowledge of the hydraulic characteristics of the reuse schemes in the area. Recognize the importance of drainage water reuse in many rice-based irrigated areas and the lack of knowledge about the reuse schemes, the specific objective of this study is to document and analyze the land, water and energy use and variability of drainage water reuse schemes within the drainage area of a major rice-based gravity irrigated canal system. The study was undertaken as a part of a comprehensive study on the reuse of drainage water (Le, 2012). The hydraulic link between the reuse schemes and the canal scheme, reuse indicators and the dependency of the reuse schemes on drainage water from the canal scheme are further analyzed and quantified elsewhere.
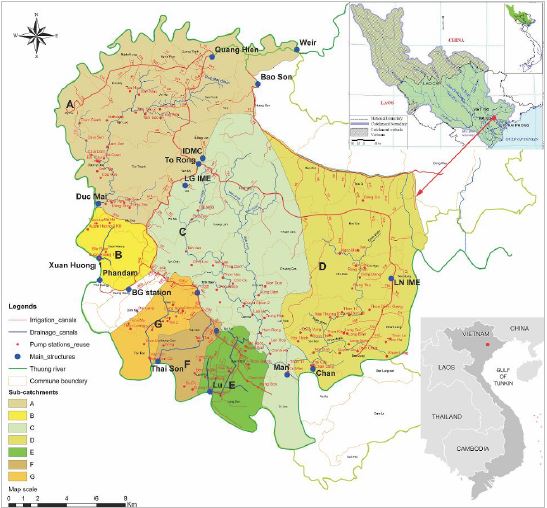
Figure 1: Cau Son irrigation and drainage area in the Red River Basin, Vietnam with main and secondary irrigation canals of the Cau Son canal scheme, main drains and structures (sluices and large-pump stations) and reuse pump stations (located along main drains) in sub-catchments A – G. 21022-21044 N, 106020- 106046 E.
Figure 2: Climate variables at Bac Giang meteorological station, 1990-2010. Mean monthly precipitation (P, mm) and reference evapotranspiration (ET0, mm), and monthly mean daily hours of sunshine (s, hr), wind speed (u, m s-1), relative humidity (RH, %), and maximum (Tmax), minimum (Tmin) and average (Ta) temperature. (Note the scaling of s and u in the graph).
2. Location – The Cau Son Irrigation And Drainage Area
The study was conducted in the spring crop seasons Jan-Jun of 2009 – 2011 in the Cau Son irrigation and drainage area, covering a total of 43,727 ha with 18,308 ha of irrigated land (Figure 1). The area is located about 70 km north-east of Hanoi, in the Cau river sub-catchment in the middle region of the Red River Basin. The climate is sub-humid tropical, with progressively increasing temperature, hours of sunshine, rainfall and reference evapotranspiration during the spring crop season generally defined as the period Jan – May (Figure 2). The rainy season normally starts in May, and wetland rice is the major crop in the area accounting for about 90% of the spring crop irrigated area.
The Cau Son area is one of 30 main irrigation and drainage systems in the Red River Basin. The area is a polder-like system enclosed by dikes and draining to the rivers Thuong and Luc Nam through 7 main sluices (sub-catchment in brackets): Duc Mai (A), Xuan Huong and Phan Dam (B), Thai Son (F), Lu (E), Man (C), and Chan (D). Three irrigation systems are found in the area: (i) the Cau Son canal scheme including some pump schemes, delivering river water diverted at the Cam Son weir in the north; (ii) numerous small and medium sized pump schemes pumping water from main and secondary drains and from rivers at the periphery of the area; and (iii) a small number of weir schemes located in drains. The Cau Son canal scheme is managed by a state-owned enterprise, the Cau Son Irrigation and Drainage Management Company (IDMC) including its three Irrigation and Management Enterprises (IME). The pump stations were managed by the public (IDMC) or by local institutions (hamlets, cooperatives and communes). Downstream of the Cam Son weir, the main delivery canal branches into 3 main canals (red bold line in Figure 1), servicing secondary canals managed by the 3 IMEs: in north-west, the Tay, Yen Lai and Giua canals servicing sub-catchments A, B and upper part of C; in north-east, the Yen Lai canal servicing sub-catchments D and lower part of C; and in the south, the Giua canal servicing sub-catchments G, E and F.
3. Methodology
3.1 Catchment Areas
The Cau Son area was subdivided into 7 sub-catchments (A-G) according to drainage lines using the 1:25,000 scale irrigation and drainage map of IDMC and Google Earth (Figure 1). The sub-catchments were enclosed by dikes and/or roads but defined to include some areas of irrigated land located between the main dike and the river, when such areas were irrigated with a mix of river water and drainage water from the area behind the dikes. However, other similarly located areas irrigated entirely with river water was excluded from the analysis. Thus, the Cau Son area considered in the following is the sum of these sub-catchment areas and therefore slightly less than the wider area enclosed by rivers.
Catchment boundaries were validated in the field. The regulators and outlets, connecting branch drains across the sub-catchments and drains with the river, were generally closed during the spring crop season to store water for irrigation as required by Central Government regulations. However, in a few planned or unplanned situations, river water did mix with drainage water at the periphery of D, E, F and G, resulting in some identified cases of areas irrigated with a mixture of river and drainage water. Sub-catchment E was open to the river via the Lu sluice only up to the Ong Thoa (OT) sluice, located in the main drain immediately upstream of the IDMC pump station Lang Son. That station was therefore irrigating areas upstream of the OT sluice as well as some downstream areas and riverbank areas, with a mix of river and drain water. Sub-catchment E covered a wide range of irrigation and reuse systems. A smaller watershed area in E – the Ong Thoa (OT) watershed – was therefore selected for pilot studies, including inter alia the pump calibrations discussed below.
3.2 Inventory Survey of Reuse Pump Schemes
An area-wide inventory survey was conducted in 2010 collecting data for 2009, identifying a total of 208 pump schemes. The pump schemes were classified as reuse and non-reuse schemes, defining a reuse-scheme as a scheme located within a sub-catchment of the Cau Son area and partly or fully pumping drainage water originating from the secondary sections of the main gravity irrigation canal system within the area. Thus, non-reuse schemes were pump schemes, where the water supply was entirely water in main irrigation canals of the Cau Son irrigation scheme or river water. A few minor weir schemes, located in the drainage system in A, C and D sub-catchments and with a total area of 884 ha, was also considered reuse schemes.
A more detailed investigation was conducted at the 109 pump schemes identified as reuse pump schemes. The survey generated information on the location (GPS) and the hydraulic characteristics of the pump schemes, pumping records and/or electricity bills, water source, maintenance and various land and water use characteristics of the command area. The survey was undertaken by trained staff and based on a rigorous procedure with quality control measures. The survey included field inspections and structured interviews with all pump scheme operators, the water management authorities of all 52 communes and managers and staff of the three IMEs of the Cau Son IDMC.
3.3 Classification of Land Use and Soils
Land use statistics were developed using ArcGIS based on information from the inventory survey, the commune-level district statistics and a digitized commune map. The catchment areas were classified as field or non-field area. Field area covered agricultural, forestry, aquaculture and fallow land while the non-field area was defined as the difference between catchment area and field area, thus including residential, infrastructure and industrial areas. The field area was sub-classified in irrigated and non-irrigated areas, and irrigated areas were further classified in greater detail by management institution (IDMC, commune, cooperative, hamlet, household), irrigation technology (gravity, lift, mixed) and source of irrigation (river, drain, mixed). The accuracy of the information on pump scheme irrigated area from the inventory survey was confirmed by mapping the actual irrigated areas of 16 reuse pump schemes, finding an average relative deviation of only 1.2% with a coefficient of variation (cV) of 8%.
The soil type of a location was determined from a digital soil map, identifying 12 soil types in the Cau Son area with the more common ones summarized in Table 1 (Dung et al., 2008). In the OT watershed, the dominant soil type in the Cau Son canal and reuse pump schemes are Pf and Pg with nearly similar root zone and moisture characteristics.
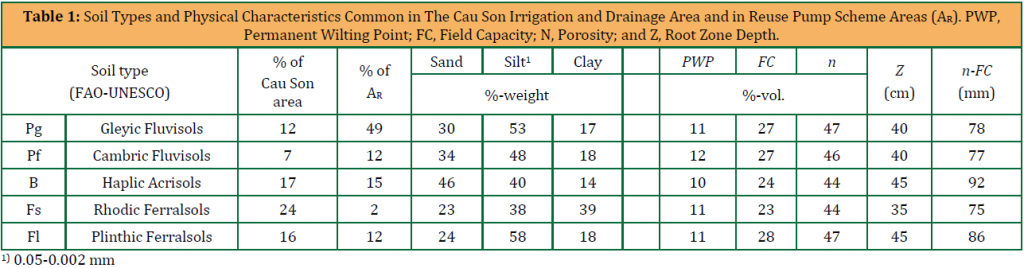
The soil type of the pump schemes was defined as the soil type identified from the soil map at the GPS location of the pump station, as maps of the irrigation scheme areas were only available in a few locations. The use of this soil type as the dominant soil type for the irrigated area of the pump scheme was checked in 12 cases where maps were established using GPS. It was found that on average 68% of the irrigated area had the same soil type as that identified at the pump location. However, the within scheme variation in soil type could probably be substantial in some schemes, with some pump schemes including both terraced fields and field in lowland positions.
For water balance analysis, the root zone depth of irrigated rice (Z) and soil moisture retention parameters were derived from typical soil profiles presented in the legend to the soil map (Table 1) (NIAPP, 2006). The root zone was defined to consist of the upper two soil layers of the profiles, as a significant increase in clay content and decrease in the prevalence of roots (“many” to “very few”) was found from the second to the third soil layer in 6 out of the 9 soil types found in the Cau Son area. At the scale of classification available, the variation in the root zone depth across the soil types was small, ranging in the reuse schemes from 35 cm to 50 cm and with an area-weighted average of 41 cm (cV= 8%). A similar root zone depth was determined for the part of the Cau Son canal scheme that irrigated areas in the OT watershed. The average soil moisture retention properties of the root zone (Table 1) were estimated using the pedo-transfer functions (Saxton, 2012).
3.4 Water Use by Reuse Pump Schemes.
3.4.1 Water Balance
The water balance of all the reuse pump schemes were analyzed to give estimates of irrigation return flows for the typical pumping period of the spring crop season 2009, i.e., Jan 01 – May 07:
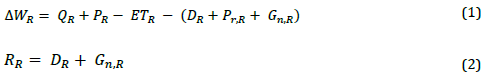
where subscript R denote reuse pump scheme and WR is change in storage in scheme domain (rootzone and standing water; final – initial); QR is pumpage, i.e. irrigation delivery; PR is rainfall and ETR is evapotranspiration; DR is surface drainage excluding direct rainfall runoff Pr,R draining from the pump scheme, Gn,R is the net sub-surface outflow from the scheme domain; and RR is return flow excluding direct rainfall runoff, to emphasize on the management aspects of reuse. The unit of the water fluxes are m3 over the water balance period considered.
The water balance period was chosen to cover the main irrigation period of the spring rice crop season in 2009, thus starting with early irrigations for seedlings on Jan 01 and ending May 07 just before major rainfalls at the start of the rainy season. The cropping calendar in the pump schemes was found to follow that of the neighboring areas in the Cau Son canal scheme within a two-week window. However, whereas the canal scheme followed a rigid irrigation schedule with rotational deliveries, the pumping in the reuse pump schemes did not follow a fixed schedule but consisted of many irrigation events dispersed over the season, from early January to the first major rains at the end of April/early May. The water balance equation was parameterized leaving the return flow RR as the only unknown to be estimated by the equation.
3.4.2 Storage Change (ΔWR)
Change in the water storage in the water balance domain is the sum of changes in storages in the root zone and in the surface storage layer (standing water). The change was calculated as the initial saturation requirement plus the increment in standing water during the water balance period. The former was estimated based on the soil water retention parameters of Table 1 and the specific soil type at the pump scheme locations, as the rootzone storage at saturation minus initial rootzone storage. The increment in standing water was calculated as final minus initial field water depth, assuming a final water depth of 5 cm as the water balance periods typically ended with an irrigation application.
Initial wetness could be quite variable and had to be estimated based on broad field observations during the inventory survey in the 3 IME areas of the Cau Son scheme area during Jan – Feb, 2009. The wetness was generally observed to be similar in the Cau Son canal and pump scheme areas, but with some variability across the IME areas. Thus, the soil was found to be saturated in 30%, 10% and 7% of the 3 IME areas, with some initial standing water of about 2-3 cm. About 15% of the rice area was found to be in a dry condition without standing water, with an intermediate soil wetness estimated as the average of the permanent wilting point (PWP) and field capacity (FC). The remaining and dominant part of the 3 IME areas was in a condition between wet and dry, thus assuming the soil moisture content to equal FC. The ΔWR estimated varied across the sub-catchments from 101 mm in E to 127 mm in A.
3.4.3 Pump Discharge (QR)
The pump stations are generally uncalibrated and without records of actual pumping. A few pumps and stations were therefore calibrated, allowing the seasonal pumpage to be estimated using the information from the inventory survey on the design discharge of pumps, total dynamic head and electricity bill for power consumed in the pumping period starting Jan 01 and ending around May 07, 2009. Four of the public pump schemes were also operated for drainage during late May, then subtracting the estimated power for drainage from the bill. The pumps were electric-powered, and the two common types have design capacity (Qd) of 980 m3h-1 and 540 m3h-1, accounting for more than 80% of pumps and 90% of irrigated area at reuse stations.
The pump calibration was undertaken at five pump schemes in the OT watershed in sub-catchment E during March 2010 (Table 2). The sample included 9 pumps in 5 stations: 4 stations/pumps managed independently by hamlets, and 5 pumps irrigating 558 ha at the IDMC managed station Lang Son which is a major dual-purpose pump station for irrigation and drainage. The discharge was estimated from flow velocity measurements during steady flow in the main delivery channel with an electromagnetic current meter using 3 replicates of the flow velocity grid (Alex, 1999). The uncertainty (s) in Table 2 was calculated from an error analysis using the error-in-quadrature method based on the estimated errors of the cross-section flow area and the flow velocity.
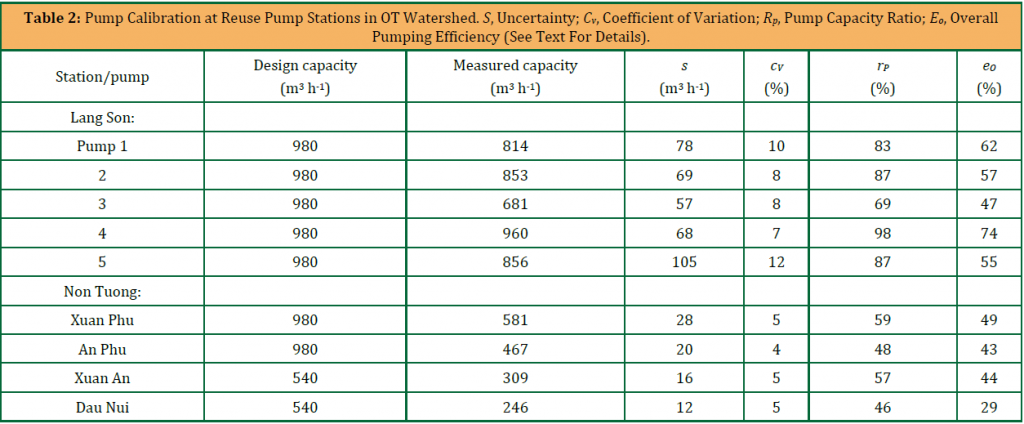
The pump capacity ratio rP (ratio of actual to design discharge) averaged only 52% at the four hamlet stations as compared to 85% at the IDMC managed Lang Son station, the latter probably being somewhat high due to recent repairs. Furthermore, the overall efficiency of the pumping system eO (“water-to-wire” efficiency, as defined by eq. (3)) of the locally managed pump stations was on average 0.41 as compared to 0.59 for the IDMC station, i.e., on average 31% lower than at the IDMC managed station. The relatively low level of performance of the local pump schemes could be caused by many factors of the pumping system including design, operation and maintenance. The inventory survey showed that the level of maintenance at locally managed stations was very low as also generally expected in the Red River Basin (MARD, 2006). Thus, the maintenance status of the pump stations was assessed as “fully maintained” for only 41% of the stations and as “no maintenance” for 19%, the remaining stations being categorized as “partly maintained”. The average age of the stations with no maintenance was 28 years, whereas stations older than 20 years by Vietnamese standards are generally expected to be rehabilitated.
Interpreting the variability in overall efficiency in Table 2 as primarily reflecting differences in management system, the pump equation was applied for estimating the pumpage (QR) during Jan 01 – May 07, 2009 at reuse pump stations with unknown calibration (Longenbaugh and Duke, 1981):
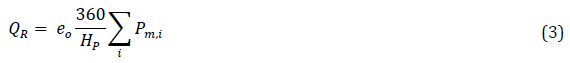
Where,
Pm,I power consumption of pump i during the period considered (kWh)
HP total dynamic head of pumps at the station (m)
eO overall pumping efficiency: 0.59 for IDMC and 0.41 for local managed systems
The total dynamic head was estimated as the sum of hydraulic head and friction losses, defined respectively as the elevation difference between the water level in the suction pool and the outlet of the pump and according to Vietnam Standard for Design of Pump Station (MARD, 2010). The total dynamic head varied somewhat during the crop season, as the water level responded to drainage inflow from the canal scheme, seasonal drawdowns and ebb/tide, with an estimated maximum variation of about 0.5 m resulting in a maximum relative error in the total dynamic head of about 10%.
Most of the 109 reuse pump stations (83%) were equipped with only one pump (i.e. i = 1 in eq. (3)) and only 3 schemes had 3 or more pumps. Whereas the actual variability in overall pumping efficiency among the local pump stations may be substantial (cV = 20%, Table 2), the inventory survey lends some support for the assumption in eq. (3) of a broad similarity in overall pumping efficiency among the local pump stations. Thus, 50% of the stations are older than 25 years, with only one pump and managed by hamlets; practically all are equipped with similar pumps produced at the Hai Duong factory north-east of Hanoi; and the stations are at a low level of maintenance and without operational regulations. It follows from the data in Table 2, that the discharge calculated from the model (eq. (3)) with average overall efficiencies differed by an average of 4% from the discharge calculated using the actual efficiencies, with a root mean square error of 7%.
The use of e0 = 0.41 finds some qualitative support in the general expectations for electric-powered centrifugal pumps. Thus, the expectation for typical efficiencies for a pump station with a centrifugal pump appropriately matched with an electric motor with power use of about 5 to 25 kW is: 0.85 to 90 (mechanical efficiency), 0.60 to 0.70 (pump efficiency) and 0.50 to 0.70 (overall pumping efficiency) (Evans et al., 1996). The median power use of the local pump stations with only one pump set was 9.5 kW, so the e0 is likely less than optimal for the relatively old and poorly maintained pump stations in our sample. The calibration data for the largest pump type (980 m3h-1) suggest a deterioration in efficiency by a factor of 0.7, estimated as the ratio of the median observed e0 of 0.49 (excluding the well-maintained pump with a very high value of 0.7) to the expected optimal value of 0.7 as suggested above.
Considering that 2/3 of the pump stations had a smaller design capacity of 540 m3h-1 and assuming an optimal value of 0.6 for a typical pump set in our sample, a reduction in efficiency by a factor of 0.7 suggests a typical value for e0 of 0.42, close to the mean value of 0.41 as selected based on the calibration data. Thus, on average only the few stations with a very small or very high design capacity and power rating could be expected to display an e0 significantly smaller or larger than 0.41, respectively. The model and the total dynamic heads (Table 4) imply, that the average specific energy consumption or unit cost of pumping (electric energy used per unit volume water pumped) was about 25% higher at local pump schemes than at the IDMC schemes, respectively 0.034 kWh m-3 and 0.027 kWh m-3.
3.4.4 Rainfall and Evapotranspiration (P and ETo)
Monthly (1960-1989) and daily (1990-2011) climate data were obtained from the Bac Giang meteorological station located east of the city at the western periphery of the Cau Son area (BG Station in Figure 1). In addition, daily rainfall measured at 12 IDMC hydraulic structures located in sub-catchments A, B, C, D and E and outside the Cau Son area was available for 2008-2011. The distance between the stations ranged from 1.6 to 45.3 km with a mean of 18.3 km.
Figure 3: Monthly rainfall in the spring crop seasons 2009 – 2011 with probability of exceedance of 25%, 50% and 75% at Bac Giang meteorological station (BG), and monthly rainfall 2011 at Lang Son pump station (LS)
According to the climate data from the Bac Giang meteorological station, spring season rainfall Jan-May incl. was typical in 2009 and 2010, with rainfall (and probability of exceedance) of 402 mm (59%) and 413 mm (34%), respectively. Seasonal rainfall was relatively high in 2011 at 443 mm (25%), mainly as a result of high rainfall in May (Figure 3).
For the water balance analysis period, rainfall was estimated at the location of pump schemes from the IDMC station rainfalls, applying the inverse distance weighting model (Ahrens, 2006) and locational data from the inventory survey. A value of -2.0 for the exponent was found appropriate and to result in the smallest root mean square error for the 2009 IDMC rainfall data. The estimated seasonal rainfall at the pump schemes varied from 150 mm to 207 mm. For the shorter period of Jan 01 – April 15, 2009, rainfall was less and more erratic with no clear spatial variability. Effective rainfall was estimated by applying a direct rainfall runoff ratio g of 0.34 as estimated in the OT watershed in 2011.
Daily and monthly reference evapotranspiration (ET0) were estimated according to a study, using the PMday and PMmon tools and climate data from the Bac Giang meteorological station (Snyder and Eching, 2003; Allen et al., 1998). The main wind direction during daily maximum wind speeds was within north-east to south-east, and the ET estimates was therefore assumed representative for the overall Cau Son area being mainly located upwind of the climate station. The Angstrom equation, used to estimate global radiation from sunshine hours, was previously calibrated in the lower delta area (Jensen, 2005). Actual evapotranspiration of irrigated areas was estimated by the crop coefficient concept (ETc = Kc . ET0), using standard values for rice and vegetables according to combined with information from the field surveys on irrigation and cropping schedules in upland and rice crop areas (Allen et al., 1998). Upland crops (mostly vegetables) covered about 10% of the irrigated areas and were of little importance for the effective crop coefficient. For the pumping period of the spring crop season Jan 01 – May 07, 2009 crop-area weighted ETc was 261 mm or 2.1 mm d-1 varying from 0.2 to 4.9 mm d-1, while the daily average Kc varied from 0.3 to 1.1 with a seasonal average of 0.90.
4. Results And Discussion
4.1 Land Use and Reuse Areas
The survey identified 208 pump schemes in the wider Cau Son area enclosed by rivers. Applying the classification scheme of sections 3.2. and 3.3, 109 of the pump schemes were classified as drainage reuse schemes and 99 were classified as non-reuse schemes. The 109 reuse schemes included 6 public managed schemes and 103 locally managed schemes. Included in the reuse schemes are 10 schemes (4 public, 6 local) classified as mixed schemes pumping a mix of river and drainage water at mixing points at the periphery of sub-catchments D, E, F, and G. The 99 non-reuse schemes included 67 schemes, pumping directly from main irrigation canals and therefore considered a part of the canal scheme, and 32 schemes pumping only from rivers at the periphery of the wider Cau Son area and classified as river-only schemes. The 32 river-only schemes included 7 schemes, that pumped river water directly to the main irrigation canal system in sub-catchments C, E, F and G; these schemes were therefore considered as a part of the Cau Son canal irrigation system. The remaining 25 river-only schemes were located entirely between the dike and rivers at sub-catchments A, C, D, E and F. These schemes did not interact with the surface hydrology of the sub-catchments and are therefore not considered a part of the sub-catchment areas and consequently excluded from further analysis.
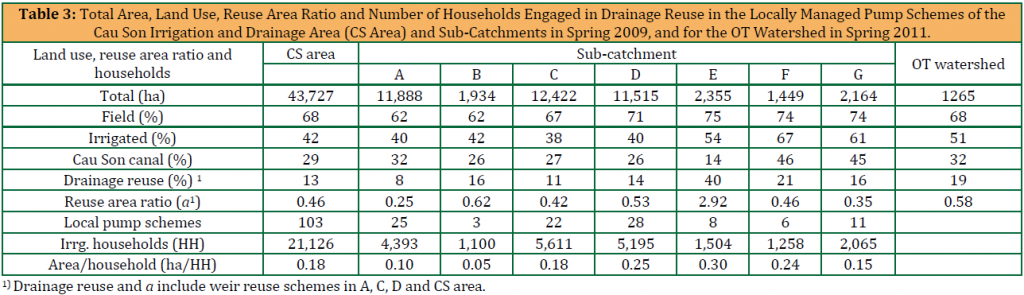
The land use statistics and details for the local managed reuse schemes are summarized in Table 3. The field area percentage varied little between the sub-catchments, while the total irrigated area of 18,308 ha was unevenly distributed among sub-catchments varying from 38% (C) to 67% (F). The total irrigated area classified above as Cau Son canal scheme was 12,528 ha, about twice the drainage reuses irrigated area of 5,780 ha including the 109 reuse pump schemes (4,896 ha) and a few weir schemes (884 ha). The area of the reuse schemes ranged from 3.4 to 200 ha and 5.6 ha to 558 ha for the local and public managed reuse schemes, respectively. The reuse pump schemes pumping a mix of river and drainage water covered a total of 1,103 ha or 19% of the total reuse area (with 16% in D, 78% in E, 21% in F and 16% in G).
The reuse area ratio (drainage reuse area / canal scheme area) in Table 3 was on average about 1:2 but with a high degree of variability among sub-catchments: from 0.25 in the undulating A to 2.92 in the downstream located E with a significant presence of mixed irrigated areas. The socio-economic importance of drainage reuse is revealed by the number of households (HH) whose livelihood depends directly on reuse irrigation. In the 103 locally managed pump schemes, 21,126 HH was engaged in drainage reuse with an average irrigated area of 0.18 ha/HH. The variability among sub-catchments was considerable, mainly reflecting the relative importance of canal to reuse scheme in the sub-catchments
Figure 4: Establishment of the Reuse Pump Stations and Evolution of Accumulated Reuse Pump Scheme Area (AR). Data From Inventory Survey 2009
The reuse pump schemes are naturally located downstream of the canal irrigation system (Figure 1). The spatial distribution reflects a combination of distance to the main irrigation canals and proximity to the main drainage system, land suitability and size of sub-catchment. The evolution of pump irrigation started in the late 1960s and increased sharply in the early 1990s (Figure 4), a period referred to as the decentralized water management period (Fontenelle, 1999). The establishment of the local drainage reuse schemes likely reflects the response of local communities to inadequacies of the public gravity irrigation systems to service the tail-end and non-irrigated areas, as previously found in the Red River Delta (Jones, 1995; Kono and Tuan, 1995).
4.2 Water Use by the Reuse Pump Schemes.
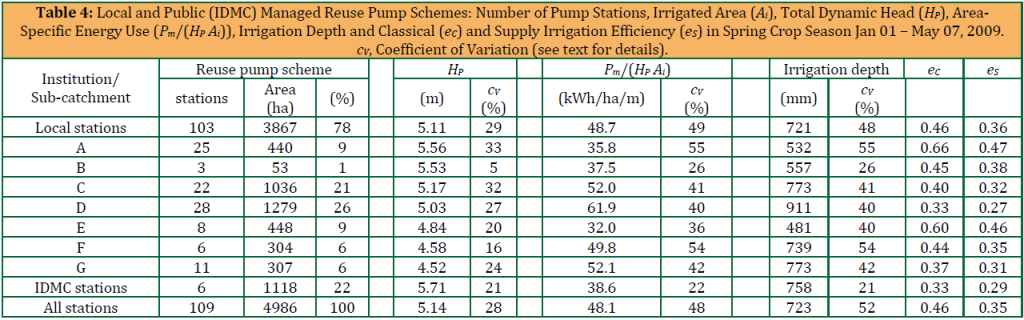
As expected from the variability in pump irrigated area, the design capacity (discharge) of pump stations varied widely, from 170 to 2940 m3 h-1. But contrary to expectations, the design capacity was not closely related to irrigated area as the area specific design capacity varied from 0.8 to 44 L s-1 ha-1 (median 5.0), equivalent to 6 to 381 mm d-1 (median 4.3). This reflects the tendency towards overdesign of pump stations caused by several factors: local politics including hamlets’ wish for electrification also for non-irrigation purposes, inadequate design standards and land surveys, and the priority of farmers for flexibility of operation (Fontenelle, 2001; MARD, 2007). Thus, the design capacity of a typical pump station was about 4 times the design flow rate of 1.2 Ls-1ha-1 of the secondary canals of the IDMC canal system. This enables the local stations to complete land preparation in only 2 days as compared to 11 days in the canal scheme. However, 18% of the stations are clearly overdesigned with a design capacity in excess of 10 Ls-1ha-1. Similar capacity values were reported for the “nearby” Bac Hung Hai polder by Fontenelle, whereas the current design guideline of MARD suggest that pump stations should be designed with a capacity requirement similar to that of the canal schemes (Fontenelle, 2001; MARD, 2010). The total dynamic head HP at the local reuse pump stations ranged from 2.7 to 10.7 m, with an average of 5.1 m (cV 29%) (Table 4). The variability among the sub-catchments reflects the generally more undulating landscape in the north-western than in the south-eastern part of the Cau Son area.
The local reuse pump schemes varied widely in seasonal area-specific energy use (i.e., the seasonal energy used per unit irrigated area and unit dynamic head, Pm/(HP Ai) ), from 9 to 103 kWh ha-1 m-1 and with a median value of 48 kWh ha-1 m-1 (Table 4 and Figure 5a). The 23 pump stations with a low design capacity of < 270 m3 h-1, found in sub-catchments A (5), C (8) and D (10), occupied a small percentage of the irrigated area but had relatively high energy consumption per unit area and head, about twice that of the pump stations with very high design capacity (Figure 5b). This implies that the ratio of irrigation depth to overall pumping efficiency was relatively high (low) at the smaller (larger) stations, since the area-specific energy use is proportional to that ratio. The low ratio at the larger local stations may suggest that the overall pumping efficiency of these stations could be relatively high and comparable to that of the calibrated IDMC station (section 3.4.3).
The power use was related to the maintenance status of the pump stations. Considering only stations (68) with design capacity of 540 m3 h-1 and one pump set (in order to remove potential effects related to design capacity and ambiguities related to the operation of more than one pump set), the fully maintained stations (13) were on average using significantly less (p < 0.05) power per unit total dynamic head (kW m-1) than stations with no maintenance (26), the remaining stations being intermediate in power use per unit head.
The variability between the sub-catchments in average area-specific energy use is partly explained by the variation in design capacity and the effect of topography on pumping requirements. Thus, most of the stations with low design capacity were found in sub-catchment D contributing to the relatively high values there. The low values in A were likely associated with the more undulating landscape in the northern part of the Cau Son area, where some schemes probably had a relatively low irrigation requirement because of low lying waterlogged areas near drains and terraced fields with field-to-field irrigation. The low values in E may be attributed to a part of the irrigated area being located in the lower catchment near the river with relatively low irrigation requirements and therefore small irrigation depths, as also estimated from the pump equation using the calibrated overall efficiency (Table 4).
The seasonal irrigation depth in the local pump schemes estimated from eq.(3) varied widely from 138 mm to 1530 mm, with a scheme average of 721 mm (5.7 mm d-1; median 5.6 mm d-1) and with the sub-catchment average ranging from 481 mm (E) to 911 mm (D) (Table 4). These estimates were – except for the calibrated stations in E – based on the assumption of a constant overall pumping efficiency across the uncalibrated schemes. The variability may therefore be influenced by the limitations of that assumption. However, the observations during the inventory survey supports the assumption of broad similarity in overall efficiency across the local pump stations as discussed above in section 3.4.3, giving some confidence in the estimates of average irrigation deliveries.
The average irrigation depth in the local schemes was within 2% of the IDMC irrigation norm for the Cau Son canal scheme of 703 mm (4.7 mm d-1) for the spring crop season Jan – May, reflecting the general similarity in cropping and irrigation practices in the local pump and canal scheme areas (BGPPC, 2005). Considering also rainfall, the average seasonal water input in the local schemes varied from 641 mm (E) to 1107 mm (D), which is in the low to medium range of values for lowland rice-based irrigation schemes in Asia like China and Philippines compiled (Bouman et al., 2007). This highlights the exceptional conditions for effective rice production in the Red River Basin, associated with the spring crop season climate and the land and water management conditions resulting in low water requirements and high rates of dry matter accumulation.
The average irrigation efficiency of the local pump schemes was generally higher than in the IDMC managed pump schemes according to the classical (eC; 0.46 vs. 0.33) and supply-based (eS; 0.36 vs. 0.29) irrigation efficiency (Table 4; eC = ET/QR , and eS similarly but including effective rainfall in the denominator). In sub-catchment E, where the estimation was based on calibrated stations, the efficiencies were about twice that of the IDMC station average. However, the irrigation efficiency was still relatively low in many local schemes, suggesting that a considerable part of the irrigation delivery became return flow in many schemes.
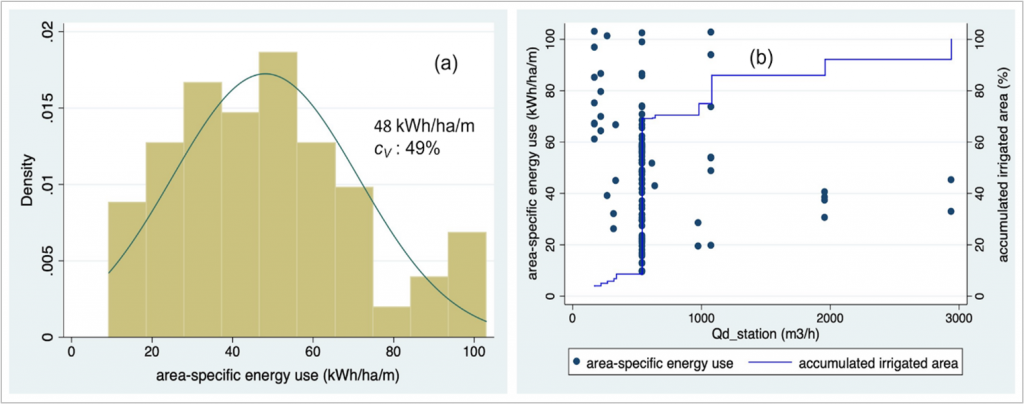
Figure 5: Area-specific energy use of local pump stations: a) distribution, median and coefficient of variation (cV); and b) distribution according to design capacity of pump stations Qd (m3 h-1) and accumulated irrigated area (%)
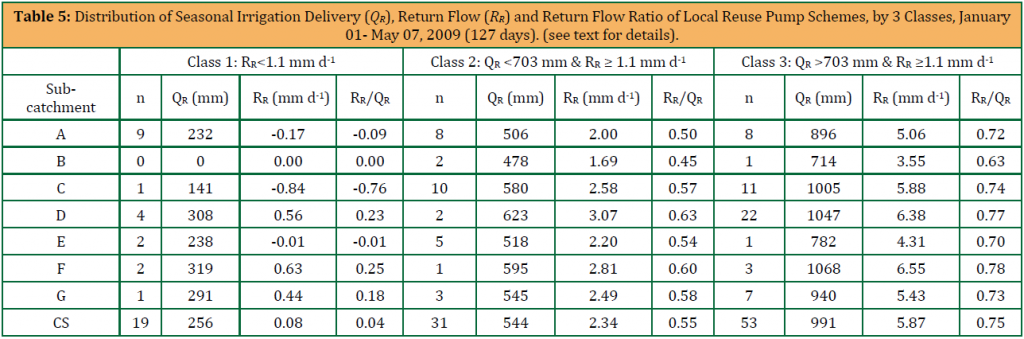
The average daily return flow (RR), estimated from the local pump schemes water balances (Table 5), varied from -0.9 to 10 mm d-1 with a seasonal average of 3.7 mm d-1 (cV= 73%) equivalent to 65% of the average irrigation delivery. The negative values may be caused by a combination of water balance errors accumulating in the RR term and sub-subsurface inflow in low lying areas. The few low and negative values of return flow (RR) occurred mainly in the undulating sub-catchment A and in schemes with low irrigation inputs and likely sub-surface inflow in low lying areas. The very high scheme-level values occurred mainly in sub-catchment D in mostly smaller schemes. For the IDMC pump schemes, the seasonal irrigation delivery varied only by a factor 2 (average 758 mm or 6.0 mm d-1) while the fraction lost as return flow was 62% and close to that in the local pump schemes.
The return flow from the reuse schemes was also a source of reuse, the recirculation of which by the pump schemes contributed to increased overall system efficiency at the sub-catchment level. A sizeable amount of the pumping by reuse schemes is likely recirculation, as indicated by the relatively high return flow ratios RR/QR in Table 5. The data is summarized in 3 classes, referring to a typical percolation rate of 1.1 mm d-1 and the IDMC irrigation norm of 703 mm mentioned above: class 1, return flow low compared to typical percolation; and class 2 and 3, return flow in excess of typical percolation and with relatively low (2) and high (3) irrigation delivery, respectively. Typically, more than 50% of the pumping could hypothetically be return flow from the reuse schemes, notably in schemes of high irrigation applications (class 3 in Table 5). The surface drainage component (DR of eq.(2)) was likely the major part of the return flow and on average considerably larger than Gn,R, as the net sub-surface outflux (Gn,R) was likely less than the reference percolation due to recapture by on-farm channels.
The energy cost is considered to be the major economic factor of the local pump stations and typically accounting for 30-40% of the total operational cost, even reaching 60% in some schemes (Harris, 2006; MARD, 2007; Fontenelle et al., 2007). The pump capacity ratio and the overall pumping efficiency of the local reuse stations could likely be improved through better maintenance. If the average overall pumping efficiency of the local stations were upgraded to the level of the IDMC stations (Table 2), up to 31% of the power consumed by the local stations in the spring crop season could hypothetically be saved, equivalent to the power requirement of 1,199 ha additional pump irrigated area or an increased pump irrigated area of 24%. Additional savings could be achieved through improved water management in many schemes with low irrigation efficiency.
5. Conclusion
The drainage reuse pump schemes constituted an important element of the irrigation system in the Cau Son irrigation and drainage area, both in terms of area, dependency of households and water and power use. About 27% of the irrigated area was covered by 109 drainage reuse pump schemes, of which 103 were under local management with about 21,000 households (HH) engaged in drainage reuse on an average irrigated area of 0.18 ha/HH. In addition, local weirs diverting water from the main drainage system constituted 5% giving a total drainage reuse area of 32%. The variability in irrigated area and water and power use was considerable among the local pump schemes, reflecting a combination of effects related to field irrigation management, maintenance level, scale, topography and the overdesign of the capacity of many pump stations.
The local reuse pump schemes generally performed below standard expectations, with low overall pumping efficiency and low irrigation efficiencies (albeit higher than in the public pump schemes). Many schemes were found to be subject to poor or a total lack of maintenance. A considerable scope for electric power savings was identified, potentially equivalent to an increase of the pump irrigated area by 24%. Additional savings may be realized by improved irrigation management reducing the sizeable return flows of about 65% of the irrigation delivery. The considerable variability in energy use per unit irrigated area and total dynamic head warrant further investigations.
Performance evaluation and water management planning in canal irrigation schemes are commonly undertaken without consideration for local drainage reuse schemes. However, considering the potential importance of drainage reuse schemes as documented in this study, drainage reuse schemes if present should be integrated in the performance evaluation and management of major irrigation and drainage areas.
References
ADB, 2009. Strengthening water management and irrigation systems rehabilitation project – TA No 7107 – VIE. Asian Development Bank, Hanoi.
Ahrens, B., 2006. Distance in spatial interpolation of daily rain gauge data. Hydrol. Earth Syst. Sci., 10, Pp. 197–208. https://doi.org/10.5194/HESS-10-197-2006.
Alex, 1999. Electromagnetic Flow Meter: Operation Manual. Alec Electronics Co., Ltd, Japan.
Allen, G.R., Pereira, S., Raes, D., Smith, M., 1998. FAO Irrigation and Drainage Paper No.56 Crop Evapotranspiration(Guideliness for Computing Crop Water Requirement). Rome: Food and Agriculture Organization of the United Nations.
Barnes, J., 2014. Mixing waters: The reuse of agricultural drainage water in Egypt. Geoforum 57, Pp. 181–191. https://doi.org/10.1016/J.GEOFORUM.2012.11.019.
BGPPC, 2005. Technical norms on operation of irrrigation schemes managed by the irrigation and drainage company in Bac Giang province. Bac Giang Provincial Peopple Committee (BGPPC), Bac Giang, Vietnam.
Biltonen, E., Hussain, I., Tuan, D.D., 2003. Pro-poor Intervention Strategies in Irrigated Agriculture in Asia. Poverty in Irrigated Agriculture: Issues and Options. International Water Management Institute.
Bouman, B.A.M., Lampayan, R.M., Tuong, T.P., 2007. Water management in irrigated rice: coping with water scarcity. International Rice Research Institute.
Bouman, B.A.M., Tuong, T.P., 2001. Field water management to save water and increase its productivity in irrigated lowland rice. Agric. Water Manag., 49, Pp. 11–30. https://doi.org/10.1016/S0378-3774(00)00128-1.
Dung, N., Toan, N., Duc, H., Nhiem, N., 2008. Classification and mapping of soil types. Publishing House of Science and Technique, Hanoi.
Evans, R., Sneed, R.E., Hunt, J.H., 1996. Pumping Plant Performance Evaluation. North Carolina State Ext. Publ., Ag452-6.
Fontenelle, J.P., 2001. Vietnam Red River Delta Irrigation Management: Incomplete Recognition of local institutional innovations. Gret.org.
Fontenelle, J.P., 1999. The response of farmers to political change: decentralization of irrigation in the Red River delta, Vietnam. Liq. Gold Pap.
Fontenelle, J.P., Molle, F., Turral, H., 2007. Who will pay for water? the Vietnamese state? S dilemma of decentralization of water management in the Red River Delta, Comprehensive Assessment of Water Management in Agriculture. CABI, Wallingford, UK.
GoVN, 2015. Decree on providing incentives for economical and efficient water use activities. Gov. Vietnam.
Hafeez, M.M., Bouman, B.A.M., Van de Giesen, N., Vlek, P., 2007. Scale effects on water use and water productivity in a rice-based irrigation system (UPRIIS) in the Philippines. Agric. Water Manag., 92, Pp. 81–89. https://doi.org/10.1016/J.AGWAT.2007.05.006.
Hama, T., Nakamura, K., Kawashima, S., 2010. Effectiveness of cyclic irrigation in reducing suspended solids load from a paddy-field district. Agric. Water Manag., 97, Pp. 483–489. https://doi.org/10.1016/J.AGWAT.2009.11.007.
Harris, D.N., 2006. Water management in public irrigation schemes in Vietnam. Impact Assess. Ser. Rep. 43, Pp. 44.
Jensen, J.R., 2005. Climate, water balance, irrigation, and nutrient loads. The Royal Veterinary and Agricultural University (KVL), Copenhagen.
Jones, W.I., 1995. The World Bank and Irrigation. World Bank. https://doi.org/10.1596/0-8213-3249-X.
Kono, Y., Tuan, D., 1995. Effect of Water Control on Rice Cultivation in the Red River Delta, Vietnam: A Case Study in the Nhue River Irrigation System. Southeast Asian Stud., Pp. 32.
Le, V.C., 2012. Return flow and reuse of drainage water in a rice-based irrigation and drainage area in the Red River Basin, Vietnam: a study on the quantification and assessment of return flow and drainage reuse for the integration of irrigation and drainage management. Faculty of Science, University of Copenhagen.
Le, V.C., Jensen, J.R., 2014. Individual lift irrigation: A case study in the Cau Son irrigation and drainage area, Red River Basin, Vietnam. Paddy Water Environ., 12, Pp. 223–238. https://doi.org/10.1007/s10333-013-0380-4.
Longenbaugh, R., Duke, H., 1981. Design and operation of farm irrigation systems, Farm pumps. American Society of Agricultural Engineers, St.Joseph, Michigan, USA.
MARD, 2010. Vietnam Standard for Design of Pump Station, TCVN 8423-2010. Ministry of Agriculture and Rural Development, Hanoi, Vietnam.
MARD, 2007. Report on the implementation of water fee policy. Ministry of Agriculture and Rural Development, Hanoi, Vietnam.
MARD, 2006. Project on assessment of the performance of irrigation and drainage system in Vietnam. Ministry of Agriculture and Rural Development, Hanoi, Vietnam.
MARD, 2004. Second Red River Basin Project. Ministry of Agriculture and Rural Development, Hanoi, Vietnam.
Matsuno, Y., Tasumi, M., van der Hoek, W., Sakthivadivel, R., Otsuki, K., 2003. Analysis of return flows in a tank cascade system in Sri Lanka. Paddy Water Environ., 1, Pp. 173–181. https://doi.org/10.1007/s10333-003-0029-9.
NIAPP, 2006. Additional survey for revison and development of soil map of Bac Giang province. National Institute for Agricultural Planning and Projection (NIAPP), Hanoi, Vietnam.
Raschid-Sally, L., Hoek, W., van der, Ranawaka, M., 2001. Wastewater reuse in agriculture in Vietnam: water management, environment and human health aspects. Proceedings of a workshop held in Hanoi, Vietnam, 14 March 2001., in: Rachid-Sally, L., Hoek, W. van der, Ranawaka, M. (Eds.), . IWMI Working Paper, Colombo, pp. vii-pp.
Saxton, K., 2012. Soil Texture Triangle: Hydraulic Properties Calculator. Pullman, WA.
Simons, G.W.H., Bastiaanssen, W.G.M., Immerzeel, W.W., 2015. Water reuse in river basins with multiple users: A literature review. J. Hydrol., 522. https://doi.org/10.1016/j.jhydrol.2015.01.016.
Snyder, R.L., Eching, S., 2003. PMday, Penman-Monteith daily. The Regents of the University of California, California, US.
Tinh, N., Thinh, L., Hung, M., 1999. Methodology applied for estimation of return flow in irrigation and drainage scheme. J. Water Resour. Sci. Technlogy.
Zulu, G., Toyota, M., Misawa, S., 1996. Characteristics of water reuse and its effects on paddy irrigation system water balance and the riceland ecosystem. Agric. Water Manag., 31, Pp. 269–283.
| Pages | 36-44 |
| Year | 2023 |
| Issue | 1 |
| Volume | 7 |
