
BIOGAS DRY REFORMING: DEVELOPMENT OF Ni/Na ZEOLITE CATALYST USING RESPONSE SURFACE METHODOLOGY APPROACH WITH REACTION MECHANISM EVALUATION
Journal: Water Conservation and Management (WCM)
Author: Abdul Hadi Abdullah, Ahmad Zamani Ab Halim, Amri Hj Mohamed, Mohd Abu Asshaary Daud, Ahmed H.A. Dabwan
Print ISSN : 2523-5664
Online ISSN : 2523-5672
This is an open access article distributed under the Creative Commons Attribution License CC BY 4.0, which permits unrestricted use, distribution, and reproduction in any medium, provided the original work is properly cited
Doi: 10.26480/wcm.01.2023.60.76
Abstract
 Biogas with the composition of 60 % methane and 40 % carbon dioxide can be used as methane replacement in Dry Reforming of Methane (DRM) for high quality syngas. Endothermically nature of DRM requires an efficient catalyst to reduce the compound activation energy and change mechanism path. A nickel-based catalyst has advantages of comparable catalytic activity and abundantly available compared to a noble catalyst. However, the nickel-based catalyst has fast deactivation and sinters at higher temperature. Many factors and variables such as metals loading percentages, addition of secondary metal, support selection and promoter can affect the catalyst performance and properties. Conventionally, quest of ideal catalyst requires a lot of experiment which are time-consuming and cost-consuming. In this research, response surface methodology (RSM) approach was used to optimize the nickel-based catalyst formulation and DRM operating condition over prepared catalyst. For catalyst formulation, Box-Behken Design (BBD) was used to find the optimum ratio of nickel (1-10 %) with the use of cobalt as secondary metal (0-10 %) and magnesium as promoter (0-5 %). NaA-Zeolite synthesis from kaolin was used as support in this research. the kinetic study was carried out in order to understand the mechanism path of DRM reaction over prepared catalyst and the effect of prepared catalyst on activation energy (Ea). After conducting mathematical and statistical analysis, the result confirmed that Ni10Co9Mg1.6/NaA-Zeolite catalyst was an optimum combination that achieved 21.93 % CH4 conversion, 33.52 % CO2 conversion, 0.904 H2/CO ratio and 0.8440 stability score. The data analysis also indicated that there was an interaction effect between variables and responses. The characterization analysis was in line with the finding. Lastly, from the kinetic study, the reaction mechanism of DRM over Ni10Co9Mg1.6/NaA-Zeolite fit well with Eley-Rideal mechanism whereby CO2 was adsorbed on the catalyst surface and CH4 maintained in gas phase. The kinetic analysis also revealed that the catalyst has low activation energy for CH4 and CO2 consumptions (46.53 kJ/mol and 39.66 kJ/mol respectively). Low activation energy of CO2 indicated the involvement of RWGS reaction.
Keywords
Biogas Upgrading, Catalyst, Dry Reforming, Water Conservation.
1. Introduction
Emission of methane and carbon dioxide or biogas from palm oil mill waste contributes to the increment of greenhouse gas. Current method of capturing biogas to be used for generating electricity is not economical and environmentally feasible (Khan, 2021). The burning of methane will increase more carbon dioxide emissions. Presently, the conversion of methane to syngas carbon monoxide and hydrogen shows a promising way to utilize the emitted biogas. The dry reforming method (DRM) is suitable for converting biogas to syngas due to carbon dioxide composition (Zhao et al., 2020). Water is essential for life on earth, and it is a finite resource that must be conserved. One way to save water is by minimizing industrial use. The industrial sector is a major consumer of water, and reducing its usage can have a significant impact on water conservation efforts. The dry reforming process is a suitable method to reduce water usage in industries. This process uses carbon dioxide instead of water to produce hydrogen and other chemicals. By implementing such technologies, we can reduce our dependence on water and ensure a sustainable future for all. Still, regarding the advantages of DRM, this method also faces problems with catalyst. Thus, this research intends to solve the problem related to DRM catalyst.
Research on DRM catalyst is well established and many scientific papers have been published on the topic regarding DRM catalyst. The most studied objective related to this topic was to find the catalyst formulation that gives high catalytic performance, maintains stability and has low material cost. Factors such as active metals selection, support selection and preparation route are variables that are needed to consider during the formulation of DRM catalyst. Findings from other research show that the combination of metals nickel (Ni), cobalt (Co) and magnesium (Mg) as alloy catalyst can improve the catalyst performance and stability at a lower cost. Researcher have studied the activity and stability of Ni–Co/Mg(Al)O alloy as catalyst for dry reforming of methane. They have reported that the basic properties of magnesium oxide might be the reason for the excellent catalyst activity and stability. The catalyst shows significant product yield at 750 °C and result from characterization of spent catalyst indicated low formation of coke (Duan, 2022).
In another work, the promoted Ni-Co catalyst shows higher average CH4 and CO2 conversions, as well as hydrogen yield. They also highlighted that the Ni-Co catalyst have comparable catalytic activity and stability based on catalytic reaction and catalyst characterization. Over 90 % feed conversion can be achieved using Ni-Co catalyst at 700 °C (Meshksar et al., 2021). In addition, Co contributed to the elimination of coke and whisker growth due to high oxygen affinity of Co (Aramouni et al., 2021). The effect of base promoters Mg, Na, Ca and K on the dry reforming methane nickel-based catalyst have been examine (Nisa, 2022). They have reported that the catalyst promoted with Mg shows highest reactant gas conversion at 700 °C with acceptable stability. Based on characterization, they have found that the catalyst promoted with Mg increased the CO2 absorption capacity. The Mg promoter also can improve the catalyst activity and stability by strengthen the interaction between the support and active site (Taherian et al., 2021). Alloy catalyst offered many advantages such as increases reducibility and dispersion of metals due to interaction effect, effect the structural properties of support and metals combination increases the resistance towards carbon deposition (Araiza et al., 2021; Wang et al., 2019; Alvarez et al., 2017).
Support selection can also influence the catalyst activity by improving the metallic particles distribution, size and metal-support interaction. Highly porous and high surface area supports are desirable to give high activity and good dispersion and the interaction between active species and support material can affects the stability and reducibility of a catalyst. Han et al. compared the performance of Ni nanoparticles catalysts supported on metal oxides (SiO2, Al2O3, MgO, ZrO2, TiO2) (Han et al., 2017). The conversion rates of CH4 and CO2 varied widely according to the support employed. The interaction between the support and active site also effects the catalyst stability, whereas the MgO showed highly resistance toward carbon formation at 800 °C reaction temperature. In a research carried out by Wysocka et al., Ni/SiO has smaller crystallite size, followed by Ni/Al2O3 (21 nm) and Ni/ZrO2 (22 nm) (Wysocka et al., 2019).
In DRM reaction, there are several research which have been published on using zeolite as catalyst support (Chen, 2021; Kweon et al., 2022; Liang, 2023; Najfach et al., 2021). A group researchers highlighted that using zeolite support can increase Ni catalytic activity and stability (Kweon et al., 2022). They compared the performance of Ni supported with zeolite and Al2O3 and reported that catalyst supported with zeolite exhibited higher conversions of both CH4 and CO2 and stability than the Ni/Al2O3 catalysts. The main reason for the high activity of Zi/Zeolite catalyst is due to in-situ reduction effect on zeolite framework (Kweon et al., 2022). In a review paper entitled Zeolite and clay-based catalysts for CO2 reforming of methane to syngas, Hambali et al. concluded that zeolite deserved the attention of using as catalyst support for DRM reaction. They listed the advantages of zeolite such as availability, peculiar structures, high affinity for CO2, environmentally friendly nature and tuneable properties to improve selectivity of target products that should be utilized to produce ideal DRM catalyst (Hambali et al., 2022; Abdullah et al., 2018). Little work has focused on the effect of micropores supports such as NaA type zeolite. Moreover, there is no published work that can be found on the combination of Ni-Co-Mg that is supported by NaA zeolite for DRM.
Determining interactions that occur between independent variables which influence the catalytic activity requires many experimental results; hence, it is cumbersome and time-consuming. In view of this situation, several researchers have employed response surface methodology approach to investigate the optimum conditions required for obtaining maximum hydrogen and syngas yield from catalytic methane dry reforming. Izhab et al. used CCD/RSM to evaluate the effect of operating variables on product yield and quality (Izhab et al., 2021). They used 3D surface graph to visualize the interaction effect between the variables and response (Izhab et al., 2021). Hambali et al. used RSM to find the optimum condition for DRM reaction over Ta-promoted Ni/ZSM-5 fibre-like catalyst. By employing mathematical and statistical evaluations, they found that the optimum CH4 conversion that was predicted from the response surface analysis was 96.6% of CH4 conversion at reaction temperature of 784.15 °C, CO2:CH4 feed ratio of 2.52, and GHSV of 33,760 mLg−1h−1. They also reported that the calculated error between experimental and model simulated result was 0.8 % (Hambali et al., 2021). There are several researchers have reported that RSM can be useful tools to find the optimum catalyst formulation or reaction condition in DRM research field (Rezaei et al., 2019; Yusuf et al., 2022; Khoja et al., 2019).
Numerous kinetic and mechanistic studies conducted by researchers over Ni-based catalysts for DRM. It has been verified by several investigations that the performance and kinetic of reforming reactions depend on catalyst type, shape, size and dispersion of catalyst particles. Kinetic and mechanistic data can be used to develop an in-depth understanding and insight as to how rate laws are formed. Form of rate law can be used to evaluate the rate law parameters and postulate the reaction mechanism and rate-limiting steps. Sun et al. investigated the kinetics and mechanistic studies of methane dry reforming over Ca promoted 1Co–1Ce/AC-N catalyst. The obtained experiment data were fitted by three typical kinetic models (Power Law, Eley-Rideal and Langmuir-Hinshelwood). The fitting results demonstrated that the best prediction of reforming rates can be provided by Langmuir-Hinshelwood model for the reaction temperatures between 650 and 800°C (Yun et al., 2021). Other than model discrimination method, rate law via deducing method also can be used to evaluate the reaction mechanism (Karemore et al., 2022).
This research involves in formulating and characterizing the Ni-Co-Mg catalyst with NaA zeolite support for dry reforming of methane using BBD/RSM. BBD/RSM was used as mathematical and statistical tool in evaluating optimum formulation for Ni-Co-Mg/NaA-Zeolite catalyst. The effect of metals loading range was selected based on literature review. In this research, kaolin was utilized as sources of alumina and silica for Na-A zeolite synthesis via alkali hydrothermal reaction method. For DRM catalytic testing over prepared catalyst, the gas composition of 60% CH4 and 40% CO2 was used to simulate. A series of DRM reaction experiments were carried out at different reactants and product compositions in order to obtain main data for reaction mechanism evaluation. The mechanism was evaluated by using reaction rate law deduction method and model discrimination method. The activation energy (Ea) was determined based on DRM reaction at different reaction temperatures.
2. Experimental
2.1 Experiment Design
This study utilized the Response Surface Methodology (RSM) approach to determine the optimal catalyst formulation for the DRM reaction. The RSM set-up, which was conducted using Design Expert 11.0.0, involved several steps. Initially, variables, response, and the range of selected variables were determined. For the formulation optimization, nickel, cobalt, and magnesium loading percentages were selected as variables with a range of 1-10 w/w%, and 0-10 w/w% and 0-5 w/w% for the other parameter variables. The response variables for catalyst formulation included CH4 and CO2 conversions, H/CO ratio, and stability score. The experiment design was chosen as Box-Behnken design (BBD), and after filling in the required parameters, the software generated a table of 17 experiments, with five replications of the middle point.After catalyst preparation and testing were performed according to Table 1, the data from the experimental work were filled into the software. Mathematical and statistical evaluation was evaluated by the software according to the given parameter. The result from the software which was present in the form of mathematical, statistical and plotted graph were used to discuss the interaction effect between variables and response.
The software was also used to optimize the variables for ideal response based on mathematical and statistical evaluation. The software generated a set of solution based on given parameters for optimization. The solution with the highest probability was selected and the simulated result was compared with experimental result. Based on the result, the difference between simulated and experimental date was used to calculate the accuracy of optimization parameters. The characterization techniques such as TGA, FESEM and surface analyser were used to confirm the result based on catalyst properties.
2.2 Support Preparation
Local kaolin purchased from Kaolin Malaysia Sdn. Bhd. was used to prepare the NaA Zeolite support. To separate the quartz, the raw kaolin was refined with sodium hexametaphosphate, using a fixed amount of 2.5% from the raw kaolin, and diluted with water to maintain a ratio of 1:5 (w/w) of water to solid phase. The pre-treatment was conducted at room temperature for 2 hours under stirred conditions, followed by 1 hour of settling time to allow for the separation of heavy quartz from kaolin. The supernatant was then dried in an oven for 24 hours at 105 °C, and the dried kaolin was further calcined at 800 °C for 2 hours to convert the kaolin phase to metakaolin. The alkaline hydrothermal reaction was carried out using a 2.75 M NaOH solution, with a fixed ratio of metakaolin to NaOH solution at 1:13.3 (w/v), under stirring conditions at 70 °C for 2 hours. After complete crystallization of NaA Zeolite, which was controlled at 60 °C for 12 hours, the filtration and naturalization of the zeolite were conducted using vacuum filtration, followed by washing with distilled water. Finally, the NaA Zeolite was dried overnight in an oven at 105 °C and stored for future use.
2.3 Preparation of Catalyst
The catalyst was prepared using the incipient wetness method. To prepare the catalyst, the metal nitrate was dissolved in distilled water and used as a precursor. Chemical Nickel (II) nitrate 6-hydrate, Cobalt (II) nitrate 6-hydrate, and Magnesium nitrate 6-hydrate were purchased from Merck. For catalysts with combined metals, the co-impregnation method was employed, with the amount of metal loading determined by the experiment design. The ratio of metal nitrate solution to NaA Zeolite support was fixed at 3 ml of solution for 1 g of support, and impregnation was carried out at ambient temperature for 12 hrs. Subsequently, the catalyst was dried at 105 °C to remove water and calcined at 550 °C for 2 hrs to form the metal oxide. The catalyst was then stored in an airtight container for future use.

2.4 Catalytic Reaction
A lab scale fixed bed reactor was used to carry out the dry reforming reaction for catalytic testing, as depicted in Figure 1 of the process flow diagram. Gas chromatography was used to analyze the composition of the product and reactant gases. The simulated gas used for the catalytic reaction contained 42% CO2 and 58% CH4 and was purchased from Linde Gas Sdn Bhd. The inlet gas flow was regulated using a mass flow controller. 10 mg of catalyst was filled into a tubular quartz reactor with an internal diameter of 4 mm and an outer diameter of 6 mm, and the catalyst was positioned at the middle of the reactor and sandwiched with quartz wool. Prior to the reaction, the catalyst was in-situ reduced at 550 °C with H2 flow at 30 ml/min for 30 minutes. The reactant gas was then introduced with a flow rate of 30 ml/min, and the product gas was monitored every 15 minutes using gas chromatography. The reaction was carried out for 60 minutes, and the reactant conversion was calculated using the provided equation.


The quality of product syngas was calculate based on the ration of H2 and CO as the following equation:

The stability of the catalyst was calculated based on the following equation and this equation was modified from previous literature:
Stability Score
Figure 1: Equipment set-up to simulate biogas dry reforming experiments
2.6 Thermogravimetry Analysis
The thermogravimetry analysis was carried out using Mettler Tolledo TGA/STDA851 equipment. The weight loss due to heating at the temperature range of 30 – 900 °C was evaluated on spent catalyst. The sample was placed in a 40 μL alumina crucible and was heated under air flow at 0.l L/min.
2.7 Kinetic Study
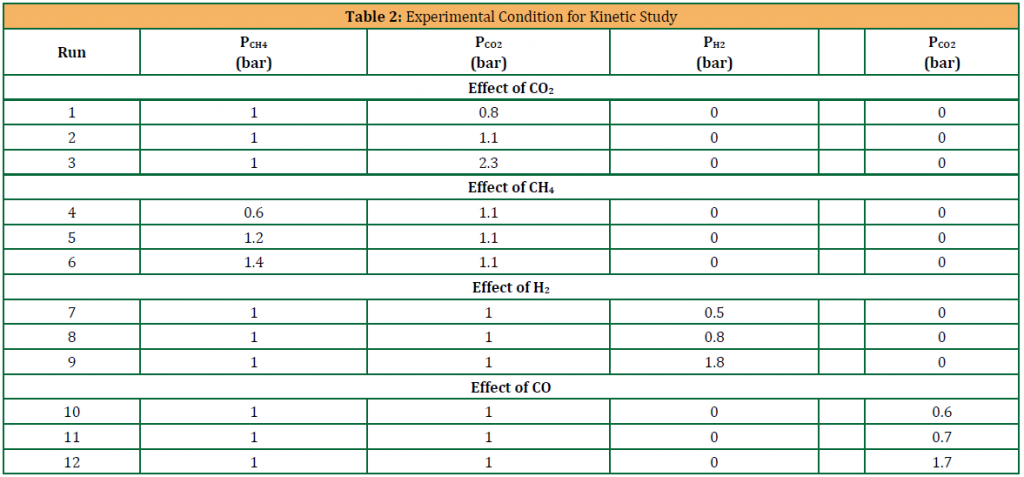
The method for isotherm, kinetic and thermodynamic studies was based on the study conducted by Ayodele et al. with minor modification (Ayodele et al., 2016). The effect of reactant and product on the reaction rate was investigated by varying the partial pressure of each compound. Table 2 shows full parameters that were used for the kinetic evaluation of DRM reaction over catalyst. Before the reaction, the gas was mixed according to Table 2 in a sample bottle. The catalytic activity was carried out similarly as the catalytic activity that was mentioned in catalytic evaluation experiment. For the kinetic study, in-situ reduction was carried under pure H2 atmosphere at 650 °C for 30 minutes. The DRM reaction was carried out at a fixed temperature of 700 °C and the inlet gas was controlled at 30 ml/min. The amount of catalyst was fixed at 10 mg for the experiment. The activation energy of DRM reaction was carried out by varying the reaction temperature at 550, 600, 650 and 700°C. The reaction rate was estimated from following equation:
products (mol i g cat-1min-1); v0 is the exit flow rate (dm3min-1), Ci is the exit species i concentration (moldm-3) and ΔW is the catalyst weight.
3. Result And Discussion
3.1 Nickel Powder Catalyst: Preliminary Study
Through years of research and publications, it has been reported that nickel metals is the most studied catalyst for DRM. Ni shows the highest catalytic activity for DRM reaction compared to others transition metals (Guharoy et al., 2021). The material cost is also the significant factor for the selection of Ni metals even though the catalytic activity of Ni is relatively low compared to precious metal. The catalytic activity of Ni metals depends on the contacted surface area during the reaction. When the surface area is high, the catalytic activity increases. Therefore, many researchers attempt to synthesis or modify the Ni metals with smaller particles size and with high contacted surface area. Without using support, high surface area of Ni can be achieved by using Ni nanoparticles.
The software was also used to optimize the variables for ideal response based on mathematical and statistical evaluation. The software generated a set of solution based on given parameters for optimization. The solution with the highest probability was selected and the simulated result was compared with experimental result. Based on the result, the difference between simulated and experimental date was used to calculate the accuracy of optimization parameters. The characterization techniques such as TGA, FESEM and surface analyser were used to confirm the result based on catalyst properties.
In this research, the powder of unsupported Ni particles was prepared using Ni(NO3)2.6H2O salt. The precursor salt was dried and oxidized at 550 °C to form NiO powder particles. The catalytically active Ni particles were formed after reducing with H2 stream at 550°C. The reduction process was carried out in-situ before DRM reaction took place. The chemical composition of NiO powder was analysed using atomic absorption spectroscopy (AAS). The NiO powder contained 96.65 % of Ni.For the catalytic study of Ni powder, the DRM reaction was carried out at 550°C using 20 mg of Ni powder. The inlet gas contained 42% of CH4 and 58% of CO2 was introduced to the reactor at 30 ml/min. The catalyst was diluted with 200 mg of silica sand to prevent pressure drop. DRM reaction was carried out for 60 minutes. As shown in Figure 2 and Figure 3, this material showed almost no activity during the reaction. The result showed very low conversion for both CH4 and CO2 inlet gases.
This could indicate the deactivating effect of carbon at low temperature. The same result has been reported by Littlewood whereby Ni particles shows almost no activity in the first 30 minutes on stream at 500 °C and very rapidly deactivates within this time (Littlewood, 2016). The conversion cannot be immediately improved even by subsequent reaction at higher temperature. Low catalytic activity and rapid deactivation for Ni particles could be ascribed to the larger Ni particle size since the large size of Ni particles provoked carbon deposition. The coke probably covered on the surface of particles and hindered the contact with reactant gases (Li et al., 2020). The CH4 decomposition and CO disproportionation might be responsible for the coke formation. Both reactions are favourable at low reaction temperature. The slightly increase of CO2 conversion from Figure 3 could be due to the RWGS reaction. This might indicate the coke formation from methane decomposition in the observed reaction temperature window (Bonmassar, 2020).
Based on the finding, it was clear that the catalytic activity of non-supported Ni is very low compared to equilibrium conversion at 550 °C. As discussed in many publications, the particles size plays an important role to increase the catalytic activity. Large or agglomerated Ni metals will affect the active site surface area, thus reducing the catalytic activity. In some cases, the large size of particles might reduce the reduction ability of NiO to form Ni. This problem can be overcome by dispersing the active metals on the porous material. The particles size of Ni metals can be controlled according to the pores size. In addition, without using catalyst support, the site reaction is more favourable due to the existence of other active compounds at the surface such as CO, H2 and CO2 that are produced by DRM reaction. Adsorption and desorption mechanism of catalyst support can change this situation to make the catalyst more selective to DRM reaction. Besides that, the catalyst may have the ability to remove deposit coke by using catalyst support. Hence, the catalyst can withstand coke formation and increase the stability.
3.2 RSM Model Validation
In this research, nickel, cobalt and magnesium were selected as active metals for catalyst. Nickel is well known for DRM catalyst that has been studied by many researchers. Instead of abundantly available, the catalytic activity of nickel catalyst is high compared to other metals. Cobalt shows high catalytic activity for the important dry reforming of methane (DRM) reaction. However, it is prone to deactivation. Chen et al. found that cobalt is mainly deactivated by carbon deposition (Chen et al., 2020). In this research, magnesium was selected due to its ability to increase the thermal stability of the catalyst. According to Zhang et al., magnesium can maintain the stability of the hierarchical structure at high temperature. Besides that, MgO also provides carrier activation channel of CO2 and improves catalytic activity (Zhang, 2018).
As discussed in the introduction, the quest for catalyst formulation depends on multiple variables that need to be controlled and experimented. In this research, design of experiment based on Box-Behnken Design (BBD) was used to reduce the numbers of experiment and thus avoid expensive experiment. BBD is an experimental designed for response surface methodology that is used to explore the relationship between several variables and response variables. The main objective of using response surface methodology is to obtain optimal response within the range of selected variables. In the first part of the research, the nickel loading percentages, cobalt loading percentages and magnesium lading percentages on NaA-Zeolite support were selected as variables. Three level BBD was selected to find the optimum formulation for DRM catalyst. The optimum formulation was selected based on the impact of variables on the response variable, including CH4 conversion, H2/CO ratio and catalyst stability. The calculation method for response variables and statistical procedure was mentioned in experimental methodology. A total of 17 experiments including replication of central points were carried out as shown in Table 3.
The suitability of a model can be determined by evaluating the significance of the regression model, the significance of individual model coefficients and lack-of-fit. In an experimental design, analysis of variance (ANOVA) can be utilised to evaluate the aforementioned variables. Thus, the generated model was assessed for validity of using ANOVA. The results of BBD ANOVA for CH4 conversion are displayed in Table 4. The relevance of model terms is demonstrated when the value of Prob > F is less than 0.05. A variable is more important when both its p-value and F-value are smaller.
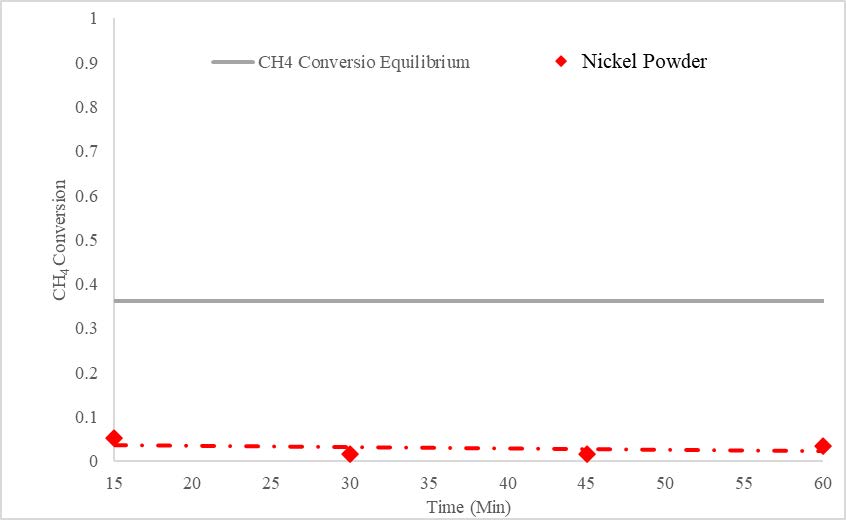
Figure 2: CH4 conversion profile for dry reforming of CH4 on NiO catalysts (50 mg of catalyst, 1 hr of reduction at 550°C, 1 hr of reaction at 550°C, CH4/CO2= 0.6/0.4, Flow rate 30 mlmin-1)
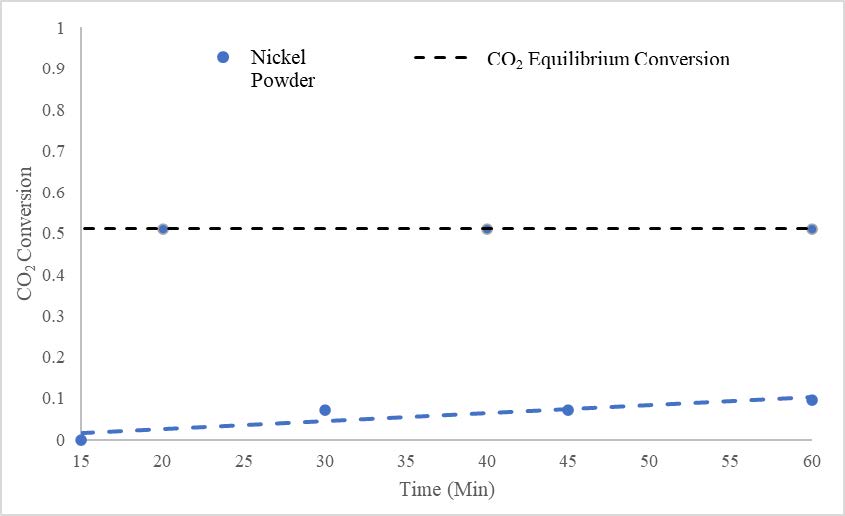
Figure 3: CO2 conversion profile for dry reforming of CH4 on NiO catalysts (50 mg of catalyst, 1 hr of reduction at 550°C, 1 hr of reaction at 550°C, CH4/CO2= 0.6/0.4, Flow rate of 30 mlmin-1)
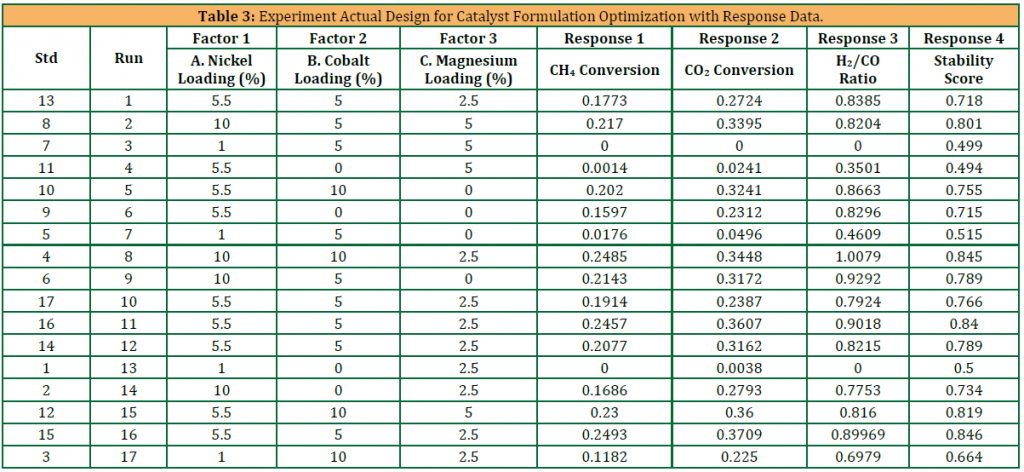
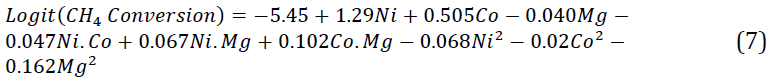
Among a number of variables which included nickel loading (A), cobalt loading (B) and magnesium loading (C), the second-order effect of variables A2, C2 and AB as well as AC and BC had a substantial impact on the CH4 conversion model. According to the F-values shown in Table 4, nickel loading had the greatest effect on CH4 conversion, whereas magnesium loading had the least effect on CH4 conversion. Since the overall F-value was 45.11, the quadratic model was found to be significant. The significance of the parameters could be ranked as follows based on the ANOVA results: A> B> A2> C> BC> AB> C2> AC> B2.
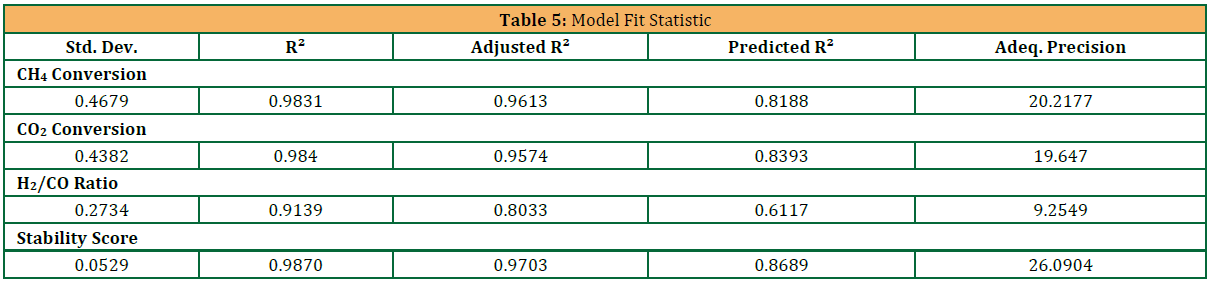
Considering the coefficient of determination (R2), it could be claimed that the model’s level of predictability was satisfactory. According to Table 5, the predicted R2 (0.9613) was consistent with the adjusted R2 (0.9613) (0.8188). The adequate precision of the signal-to-noise ratio is one of the other essential components of model estimate. To demonstrate the precision, a ratio greater than 4 is desired. In the quadratic model of CH4 conversion, a ratio of 20.218 indicated an adequate signal. The quadratic models for CH4 conversion percentage by real and coded factors are represented by Equation (6) and Equation (7) respectively. Positive and negative signs in front of model terms indicate synergistic and antagonistic effects respectively.
Model with coded factors:

|
Table 4: Analysis of Variance (ANOVA) |
||||||
|
Source |
Sum of Squares |
Mean Square |
F-value |
p-value |
Coefficient Estimate |
Standard Error |
|
CH4 Conversion |
||||||
|
Model |
88.88 |
9.88 |
45.11 |
< 0.0001 |
|
|
|
A-Nickel |
35.59 |
35.59 |
162.58 |
< 0.0001 |
2.11 |
0.1654 |
|
B-Cobalt |
18.44 |
18.44 |
84.24 |
< 0.0001 |
1.52 |
0.1654 |
|
C-Magnesium |
6.85 |
6.85 |
31.3 |
0.0008 |
-0.9254 |
0.1654 |
|
AB |
4.53 |
4.53 |
20.67 |
0.0026 |
-1.06 |
0.2339 |
|
AC |
2.26 |
2.26 |
10.31 |
0.0148 |
0.751 |
0.2339 |
|
BC |
6.52 |
6.52 |
29.79 |
0.0009 |
1.28 |
0.2339 |
|
A² |
8.09 |
8.09 |
36.97 |
0.0005 |
-1.39 |
0.228 |
|
B² |
1.01 |
1.01 |
4.63 |
0.0685 |
-0.4906 |
0.228 |
|
C² |
4.29 |
4.29 |
19.61 |
0.0031 |
-1.01 |
0.228 |
|
CO2 Conversion |
||||||
|
Model |
71.05 |
7.11 |
36.99 |
0.0001 |
|
|
|
A-Nickel |
23.21 |
23.21 |
120.85 |
< 0.0001 |
2.41 |
0.2191 |
|
B-Cobalt |
11.41 |
11.41 |
59.4 |
0.0003 |
1.19 |
0.1549 |
|
C-Magnesium |
4.96 |
4.96 |
25.8 |
0.0023 |
-0.7871 |
0.1549 |
|
AB |
3.77 |
3.77 |
19.62 |
0.0044 |
-0.9706 |
0.2191 |
|
AC |
4.45 |
4.45 |
23.15 |
0.003 |
1.05 |
0.2191 |
|
BC |
2.4 |
2.4 |
12.51 |
0.0123 |
0.7749 |
0.2191 |
|
A² |
8.55 |
8.55 |
44.52 |
0.0005 |
-1.42 |
0.2136 |
|
B² |
0.0066 |
0.0066 |
0.0346 |
0.8586 |
-0.0397 |
0.2136 |
|
C² |
3.14 |
3.14 |
16.33 |
0.0068 |
-0.863 |
0.2136 |
|
AB² |
1.82 |
1.82 |
9.46 |
0.0218 |
-0.9529 |
0.3099 |
|
H2/CO Ratio |
||||||
|
Model |
5.56 |
0.6176 |
8.26 |
0.0055 |
|
|
|
A-Nickel |
2.73 |
2.73 |
36.49 |
0.0005 |
0.584 |
0.0967 |
|
B-Cobalt |
1.2 |
1.2 |
15.98 |
0.0052 |
0.3865 |
0.0967 |
|
C-Magnesium |
0.0378 |
0.0378 |
0.505 |
0.5003 |
-0.0687 |
0.0967 |
|
AB |
6.91E-07 |
6.91E-07 |
9.24E-06 |
0.9977 |
-0.0004 |
0.1367 |
|
AC |
0.0047 |
0.0047 |
0.063 |
0.8091 |
0.0343 |
0.1367 |
|
BC |
0.4384 |
0.4384 |
5.86 |
0.046 |
0.3311 |
0.1367 |
|
A² |
0.5174 |
0.5174 |
6.92 |
0.0339 |
-0.3505 |
0.1333 |
|
B² |
0.108 |
0.108 |
1.44 |
0.2685 |
-0.1601 |
0.1333 |
|
C² |
0.4201 |
0.4201 |
5.62 |
0.0496 |
-0.3159 |
0.1333 |
|
Stability Score |
||||||
|
Model |
1.49 |
0.1653 |
59.06 |
< 0.0001 |
0.8365 |
0.021 |
|
A-Nickel |
0.7045 |
0.7045 |
251.65 |
< 0.0001 |
0.2967 |
0.0187 |
|
B-Cobalt |
0.0632 |
0.0632 |
22.56 |
0.0021 |
0.1256 |
0.0265 |
|
C-Magnesium |
0.1511 |
0.1511 |
53.98 |
0.0002 |
-0.1374 |
0.0187 |
|
AB |
0.0541 |
0.0541 |
19.33 |
0.0032 |
-0.1163 |
0.0265 |
|
AC |
0.031 |
0.031 |
11.07 |
0.0126 |
0.088 |
0.0265 |
|
BC |
0.0461 |
0.0461 |
16.45 |
0.0048 |
0.1073 |
0.0265 |
|
A² |
0.1663 |
0.1663 |
59.41 |
0.0001 |
-0.1985 |
0.0257 |
|
C² |
0.045 |
0.045 |
16.08 |
0.0051 |
-0.1032 |
0.0257 |
|
A²B |
0.0229 |
0.0229 |
8.18 |
0.0244 |
0.107 |
0.0374 |
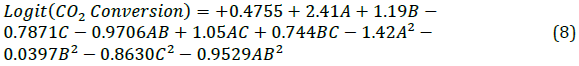
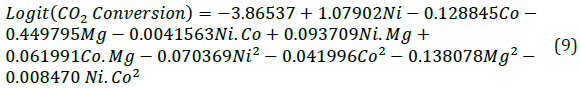
By using Equation (8) and Equation (9) respectively, the empirical relationship between independent variables and CO2 conversion percentage in terms of coded factors and real factors was evaluated based on RSM results.
Model with coded factors:
Model with actual factors:
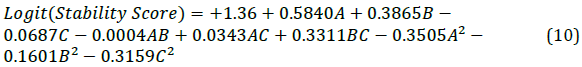
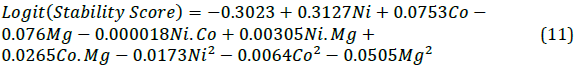
Nickel loading was found to have the greatest impact on stability score, which was similar to the models for CH4 conversion and CO2 conversion. According to Table 4, the magnesium loading percentage had the least noticeable impact on the results. The model developed (Equation (10)-(11)) in this investigation was appropriate since it showed a true link between independent variables as indicated by the low P-value and a reasonable coefficient of determination (R2 = 0.9139). Additionally, adjusted R2 and predicted R2 almost agreed, demonstrating high goodness of fit of the model (Table 5).
Model with coded factors:
Model with actual factors:
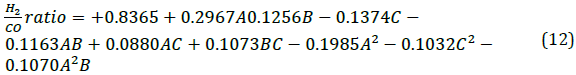
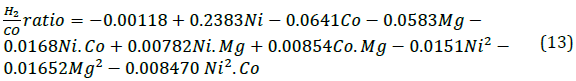
Finally, nickel loading percentage is the variable with the greatest influence on H2/CO ratio. As shown in Table 4, the cobalt loading percentage (B) had the least effect on the response. R2 (0.9870) and the p-value for lack of fit (0.3554) suggested that the BBD model proposed in this study accurately predicted the H2/CO ratio. The predicted R2 (0.9703) agreed satisfactorily with the adjusted R2 (0.8689) (Table 5). The adequate precision of the H2/CO ratio, which was 26.0904, validated the validity of statistical prediction. Polynomial prediction models for H2/CO ratio were created using the BBD model for both real and coded factors. The models are described in Equation (12) and Equation (13) respectively.
Model with coded factors:
Model with actual factors:
The normal probability plot of the studentized residuals was used to figure out how good the models were. Figure 6(a–d) shows the normal probability plot and how it compares to the studentized residuals of responses. As shown in Figure 6(a–d), the residual points were in the right spot around the straight line. This means that the distribution of errors was normal, the data was normal, and the least-square fit was good.
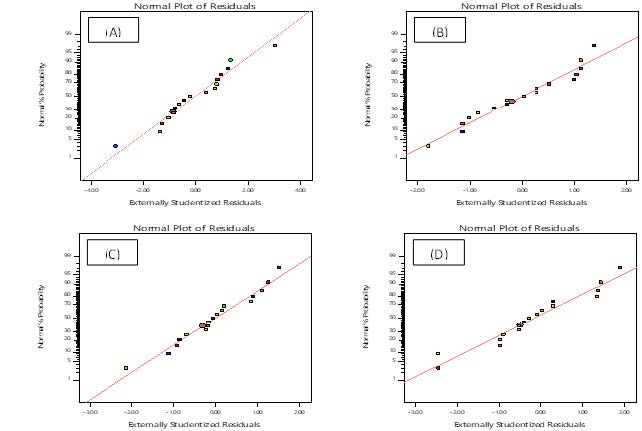
Figure 6: Normal probability plot of residual for (a) CH4 conversion, (b) CO2 conversion, (c) stability score and (d) H2/CO ratio
3.2.1 Impact of Metals Loading on the Feed Conversion
Figure 7 and Figure 8 show the effects of different input variables on feed conversion such as nickel loading percentage, cobalt loading percentage and magnesium loading percentage as 3D surface plots and contour plots. Figures 7 (a and b) and Figures 8 (a and b) show that feed conversion went up in all of the samples studied as nickel loading went up. This was likely because nickel can lower activation energy and speed up reactions (Wu et al., 2019). In addition, with an increase in cobalt loading percentage, the feed conversion also improved, indicating that the cobalt active site was capable of dissociating CO2 into CO and O2 and boosting the DRM reaction (Figure 7 (a and c) and Figure 8 (a and c)) (Khairudin et al., 2021). Referring to Figure 7 (b and c) and Figure 8 (b and c), the feed conversion of CH4 and CO2 decreased as the magnesium loading percentage increased. Arbag reported similar finding in which the catalyst activity reduced after the addition of Mg (Arbag, 2018). This situation might be related to the strong interaction between NiO and MgO, thus increasing the reduction temperature of catalyst. Arbag also concluded that the incorporation of Mg enhances the contribution of reverse water gas shift reaction. According to Karam et al., high Mg loading causes the mean size of nickel particles to grow. Some nickel atoms are trapped at the interface between nickel nanoparticles and alumina walls, which may be related to the significant loss of pore ordering and reduced access to nickel nanoparticles. On the other hand, some nickels can be occluded in segregated NiO-MgO nanodomains, indicating that nickel has a strong interaction with MgO. Furthermore, the increase in basicity may play a role in keeping the nickel nanoparticles to be partially oxidized, causing a loss of nickel metallic character (Karam, 2020).
3.2.2 Impact of Metals Loading on the Stability Score
Stability score in this research is the measurement of the catalyst stability by considering both feed conversion and catalyst stability. Stability is determined based on the reduction of catalyst performance after one hour of catalytic testing. Figure 9 shows how different metal loading percentages such as nickel loading percentage (A), cobalt loading percentage (B) and magnesium loading percentage (C) affect the stability score of a catalyst. The stability score of a catalyst is an important thing to think about when making a catalyst. In DRM, the main things that cause the catalyst to fail working are the build-up of coke and/or the sintering of active sites. According to Park et al., the primary cause of catalyst deactivation is carbon deposition or coke formation. Coke formation may result from a variety of reactions, including the decomposition of methane, the Boudouard reaction, the hydrogenation of CO2, and the hydrogenation of CO. By considering thermodynamics, methane decomposition results in coke formation at higher temperatures, whereas the other three processes result in coke formation at lower temperatures (Park et al., 2022).
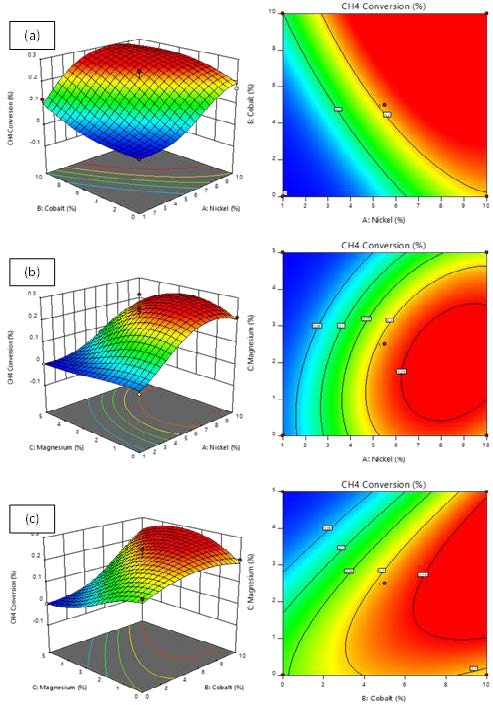
Figure 7: 3D surface and contour plots of the predicted CH4 conversion as a function of (a) Nickel loading percentage (%) and cobalt loading percentage (%) at 2.5 % magnesium loading, (b) Nickel loading percentage (%) and magnesium loading percentage (%) at 5 % cobalt loading, and (c) Magnesium loading percentage (%) and cobalt loading percentage at 5 % nickel loading.
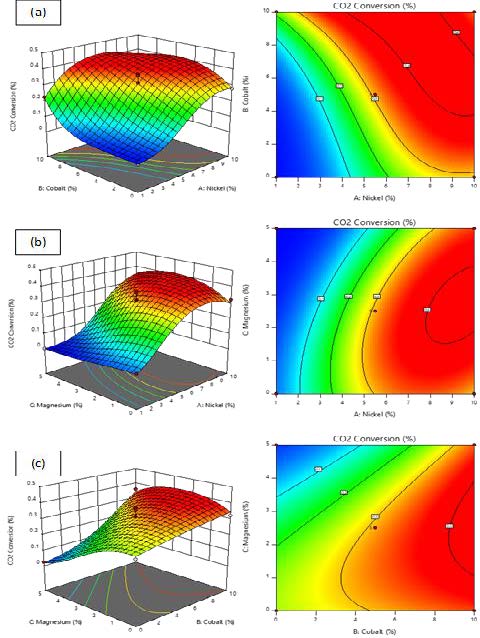
Figure 8: 3D surface and contour plots of the predicted CO2 conversion as a function of (a) Nickel loading percentage (%) and cobalt loading percentage (%) at 2.5 % magnesium loading, (b) Nickel loading percentage (%) and magnesium loading percentage (%) at 5 % cobalt loading, and (c) Magnesium loading percentage (%) and cobalt loading percentage at 5 % nickel loading.
According to the order of coke formation on the catalyst is directly proportional to the particle size of Ni, with highly dispersed catalysts exhibiting significantly less coke formation (Das et al., 2020). The reduced Ni particle size on the catalyst also enhances the interfacial area between Ni and basic sites, resulting in a synergistic effect on the coke resistance of these catalysts. Higher nickel loading results in weak metal-support interactions in catalysts due to agglomeration of nickel particles, which favours the occurrence of sintering processes and even coke deposition (Bacariza et al., 2022). Figure 9(a) and (b) show that the stability score increases as the nickel loading increases. However, the effect on the stability score becomes less significant as the nickel loading increases. The effect of cobalt loading on stability score can be observed from Figure 9(a) and (c). The result showed that the stability score slightly increases with the cobalt loading percentage. The same result has been published by Kim et al., whereby the introduction of Co into the catalyst increased the activity with only a small effect on coke formation. Cobalt addition might improve the interaction between the active site, hence increasing the resistance of the catalyst to carbon formation (Kim et al., 2018).
As shown in Figure 9(b) and (c), increasing the magnesium loading percentage from 2.5 % to 5 % had a negative effect on the stability score of the catalyst. The literature had largely highlighted the magnesium can increase the catalyst stability at optimum amount. According to Arbag [35], incorporating small amount of metal oxides which have strong basicity would increase the ability of the catalyst to chemisorb more CO2 and help to oxidize the carbon deposited on the catalyst surface (Arbag, 2018). They also mentioned that adding a small amount of strong-basic metal oxides would make the catalyst to be able to chemisorb more CO2 and help to oxidize the carbon that has built up on the surface of the catalyst. The development of the NiO-MgO mixed oxide phase increases metal-support contact, hence minimising catalyst deactivation by sintering and reducing coke deposition. A group researchers summed up that adding Mg is good because it adds basic sites to the catalyst (Karam, 2020). However, the Mg content should be controlled and kept at an intermediate level to avoid MgO segregation, which happen when there is a lot of Mg and at the same time will lead to the formation of big MgO crystals, a loss of structural ordering, a decrease in the specific surface, and a loss of accessible sites.
3.2.3 Effects of Process Variables on H2/CO RatioM
Figure 10 shows how different metal loading percentages such as nickel loading percentage (A), cobalt loading percentage (B) and magnesium loading percentage (C) affect the H2/CO ratio. As presented in Figure 10 (a and b), H2/CO ratio increased at higher nickel loading. It is possible that the contribution of water-gas shift reaction is responsible for the increase in the values of the H2/CO ratio (Anzures, 2021). In the study conducted, the researchers used a NiO/Dolamite catalyst and found that the H2/CO ratio went up as the nickel loading went up to 10%, which was because of the reverse water-gas shift reaction (RWGS) and the reduction of NiO species to active Ni (Shamsuddin, 2021). According to physical and chemical studies conducted by the increased catalytic activity of a nickel-cobalt catalyst with a 7 wt.% of cobalt oxide content is dependent on the formation of easily dispersed reduced nanophases in the catalyst, which results in an increase in activity and selectivity (Myltybayeva, 2020). Same result was found in this research, whereby the H2/CO ratio was affected by the amount of cobalt loading (Figure 10 (a and c)). The negative effect of magnesium loading percentages on H2/CO ratio is depicted in Figure 10 (b and c). This result was in line with the findings of Karam et al., which showed that the Mg-richest catalyst has a lower H2/CO ratio (Karam, 2020). This drop reflects a substantial occurrence of the Reverse Water-Gas Shift (RWGS) side reaction, which is known to occur in the same temperature range as DRM and converts CO2 and H2 into CO and H2O while consuming CO2 and H2.
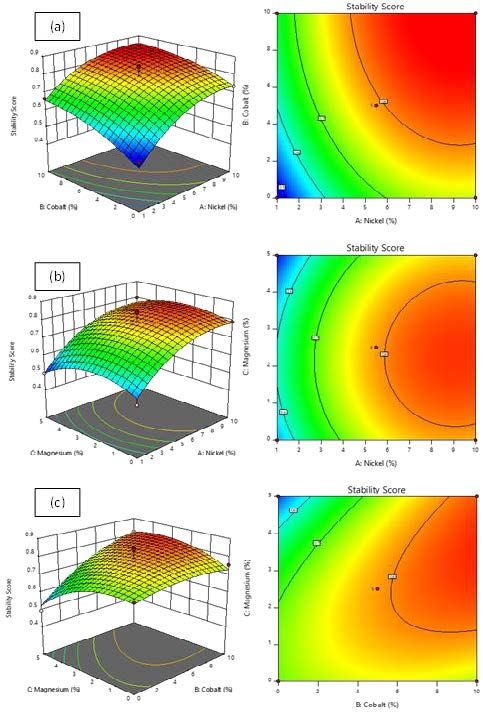
Figure 9: 3D surface and contour plots of the predicted carbon stability score as a function of (a) Nickel loading percentage (%) and cobalt loading percentage (%) at 2.5 % magnesium loading, (b) Nickel loading percentage (%) and magnesium loading percentage (%) at 5 % cobalt loading, and (c) Magnesium loading percentage (%) and cobalt loading percentage at 5 % nickel loading
3.2.4 Optimization of the Process Variables
By utilizing response surface methodology (RSM) and function optimization technique, the researchers determined the optimal catalyst formulation for the reforming process. In this research, RSM was implemented via regression analysis software (Design Expert V. 11.0.0). By considering the maximum and minimum levels of all variables which included loading percentage (A), cobalt loading percentage (B) and magnesium loading percentage (C), an optimal condition was programmed as a pre-set condition in the software to evaluate the conversion of feed, stability score and H2/CO ratio. The optimization module of the software was used to find a combination of parameters that simultaneously satisfied the requirements for all process variables and responses. Table 6 displays the optimization criteria used to get optimal values for the four responses. The primary objective was to optimize feed conversion, catalyst stability score, and H2/CO with the target of 1.0.
The software Design Expert version 11.0.0 generated 22 solutions with a desirability value of 1.000. Table 7 contains twenty solutions and the optimum condition for Solution 18 (based on the highest CH4 conversion and stability score) was chosen to conduct additional investigations. Figure 11 depicts the response surface of the optimization plot for Solution 18. Furthermore, Figure 12 depicts the desirability of all process variables and response for Solution 18. Considering the total desirability value, it was possible to conclude that the methane dry reforming process was nearly ideal within the range of the selected conditions. After the software determined the optimum condition, its validity was tested by running an experiment under the optimum condition set for Solution 18. Table 8 shows the validation results of the model of dry reforming of methane over Ni-Co-Mg/NaA Zeolite catalysts prepared under optimal conditions. The experimental data mean is within a 95 % confidence interval. The findings suggested that statistical analysis was reliable in optimizing the catalytic dry reforming process. The optimum catalyst for dry reforming of methane at a desirability level of 1.000 was shown as follows: nickel loading percentage = 9.91%, cobalt loading percentage = 8.84%, and magnesium loading percentage = 1.62%.
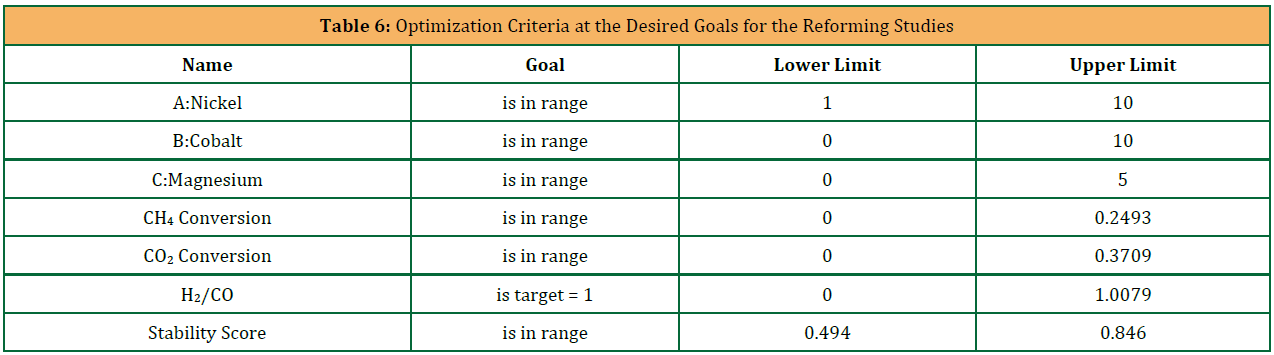
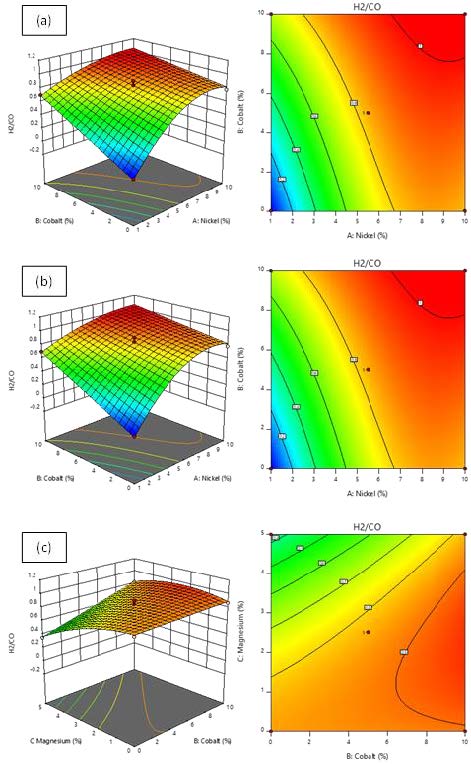
Figure 10: 3D surface and contour plots of the predicted H2/CO as a function of (a) Nickel loading percentage (%) and cobalt loading percentage (%) at 2.5 % magnesium loading, (b) Nickel loading percentage (%) and magnesium loading percentage (%) at 5 % cobalt loading, and (c) Magnesium loading percentage (%) and cobalt loading percentage at 5 % nickel
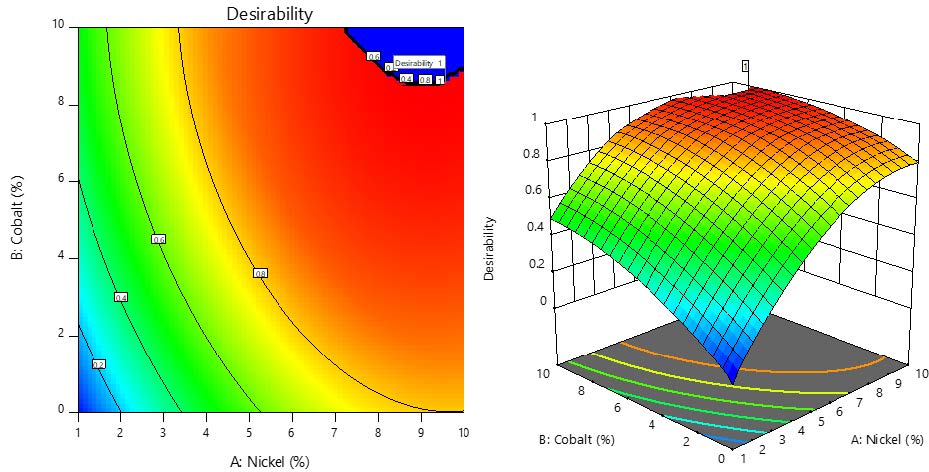
Figure 11: Response surface of the optimization plot for Solution 1 with magnesium loading 1.6 %.
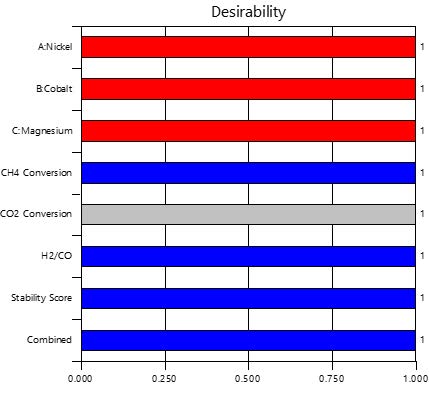
Figure 12: Desirability of the optimum condition for Solution 1
3.3 Comparing the Performance of Ni10/NaA-Zeolite and Ni10Co9Mg1.6/NaA-Zeolite
In this study, a comparison was made between the Ni10/NaA-Zeolite and Ni10Co9Mg1.6/NaA-Zeolite catalyst. The catalytic experiments were carried out at same reaction condition to compare the catalyst performance. As shown in Figure 13, the Ni10Co9Mg1.6/NaA-Zeolite catalyst showed promising reactant conversion, stability score and H2/CO ratio compared to Ni-NaA zeolite. From the result, at reaction temperature of 550°C, the methane conversion increased from 15% to 21% with the use of Ni10Co9Mg1.6/NaA-Zeolite catalyst compared to Ni10/NaA-Zeolite. The CO2 conversion also significantly changed from 25% to 34% via the use of Ni10Co9Mg1.6/NaA-Zeolite. The H2/CO ratio of Ni10Co9Mg1.6/NaA-Zeolite 0.9014 was close to 1. The alloy catalyst also increased the stability score of the catalyst from 0.709 to 0.805. The experiment data showed its agreement with other findings on the effect of using support and metallic alloy as DRM catalyst.
The characterization on fresh Ni10/NaA-Zeolite and Ni10Co9Mg1.6/NaA-Zeolite catalyst was carried out using the surface analyzer and FESEM. The result from characterization were used to investigate the physicochemical properties of catalyst. FESEM analysis allowed the researchers to conduct visual investigation of the catalyst surface. Ni10/NaA-Zeolite and Ni10Co9Mg1.6/NaA-Zeolite catalysts were layered on the carbon tape before FESEM pictures were taken. A FESEM image of the fresh Ni10/NaA-Zeolite and Ni10Co9Mg1.6/NaA-Zeolite (before reduction treatment) is shown in Figure 14. When the magnitude was increased to 50,000x, clear cubic shapes were observed. The cubic surface of Ni10/NaA-Zeolite (Figure 14 (a)) and Ni10Co9Mg1.6/NaA-Zeolite (Figure 14(b)) shows the presence of the sphere shape particles. The sphere shape might be the image of metals particles that overloaded the support pore and the particles on the tri-catalyst was uniformly distributed.
The structural properties of catalysts are summarized in Table 9. It could be observed that addition of active metals (Ni, Co and Mg) increased BET surface areas. This might be caused by the formation of metal agglomeration on the support surface. It could also be observed that the micropore surface area decreased with the addition of active metals due to pore filling of catalyst support. Furthermore, the pore volume did not show significant change compared to Ni10Co9Mg1.6/NaA-Zeolite catalyst and support.
The N2 adsorption/desorption isotherm of support and catalyst are displayed in Figure 15. For all the samples, all the isotherms were categorised into IV type isotherms with H3-shaped hysteresis loops, which were the significant features for ordered mesoporous materials. The H3-shaped hysteresis loops also illuminated that all the mesopores were slit-shaped pores channels. Furthermore, the pore size distributions of these materials are exhibited in Figure 16 and the position of the peaks of the curves were all located in the range of 13.8-14.7 nm. It could be observed that the addition of metals shifted the pore size distribution to smaller sizes.
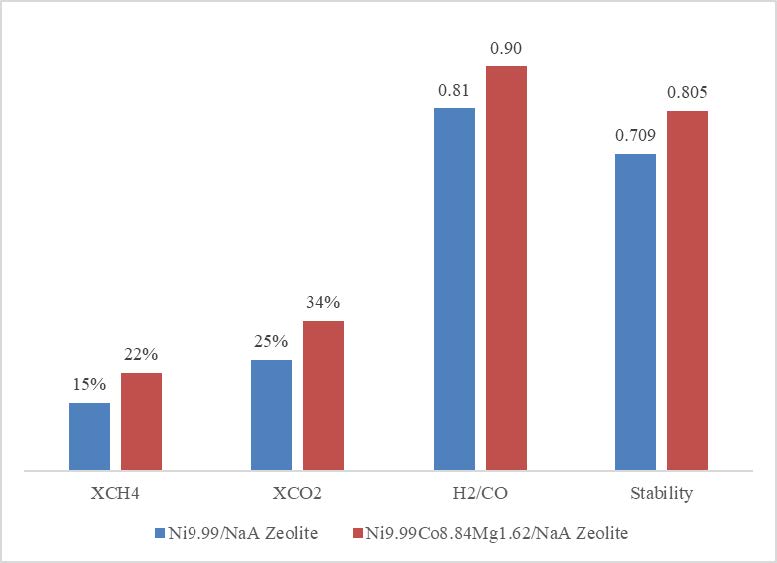
Figure 13: Comparison of catalyst activity of mono-catalyst (Ni10/NaA-Zeolite) and tri-catalyst (Ni10Co9Mg1.6/NaA-Zeolite).
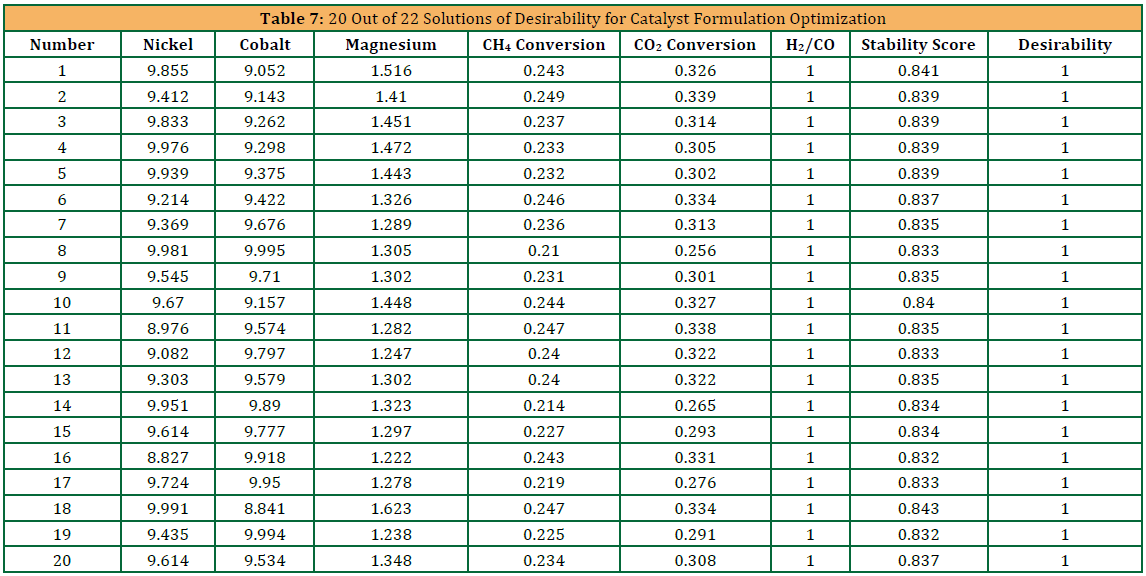

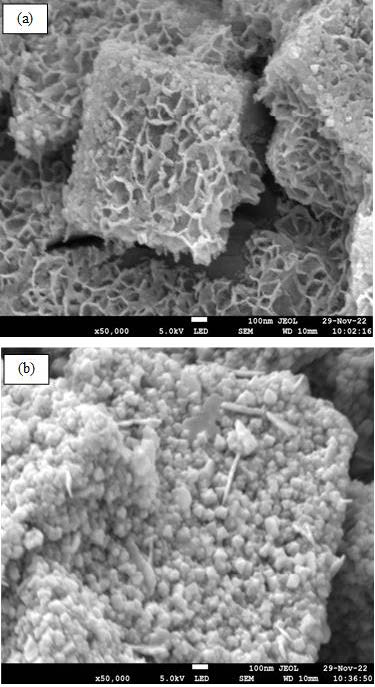
Figure 14: Fresh (a) Ni10/NaA-Zeolite and (b) Ni10Co9Mg1.6/NaA-Zeolite (50,000x of magnification)
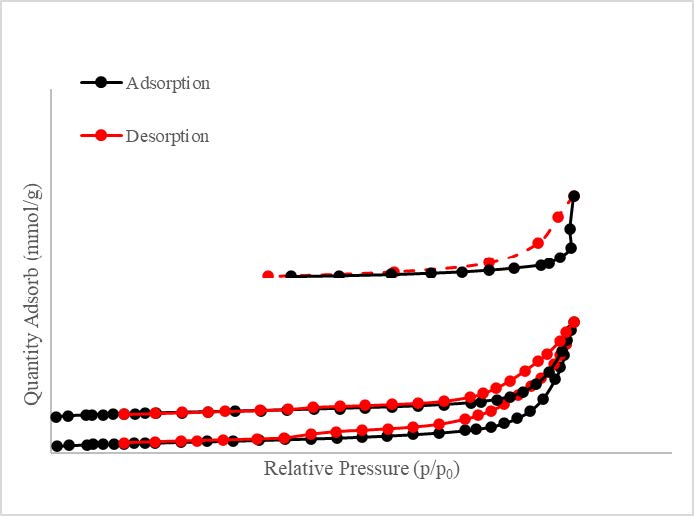
Figure 15: N2 adsorption/desorption isotherms of (a) NaA-Zeolite, (b) Ni10/NaA-Zeolite and (c) Ni10Co9Mg1.6/NaA-Zeolite
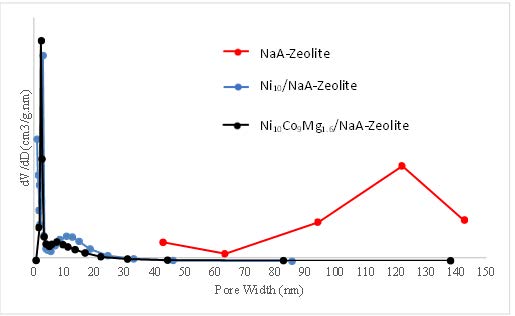
Figure 16: Pore size distributions of calcined catalysts
3.4 Kinetic Study of CO2 Reforming of CH4 Over Ni10Co9Mg1.6/NaA-Zeolite Catalyst
Reliable kinetic data could be obtained when mass transfer limitation is negligible. There are two types of possible mass transfer limitations: external diffusion and internal diffusion limitation. The external diffusion will control the overall rate of reaction if the transport rate of the gaseous species to the catalyst surface is slower than the rate of chemical reaction on the surface. The transport rate depends on the thickness of the boundary layer on the catalyst surface that is created by the flow rate of gas through catalyst bed. A higher flow rate of gas through the catalyst bed, which is higher superficial velocity, leads to an increase in the transport rate. A slower species transport rate through the pores will cause the internal diffusion to limit the overall rate of reaction. The internal diffusion effect can be reduced by increasing the species transport rate through the pores. In conclusion, the experimental conditions should be controlled in which the mass transfer affects such as external and internal diffusion are negligible. For this research, the experimental conditions were selected based on the work of Littlewood and Song (Littlewood, 2016; Song, 2010). The following operating conduction was used to carry out the kinetic tests: (1) Particle size: 354-500 μm (average = 427μm), (2) Amount of catalysis: 10 mg of catalyst, and (3) Gas flow rate: 22 mL/min (with GHSV = 132,000 cm3/g.hr).
3.4.1 Rate Law from the Experimental Data
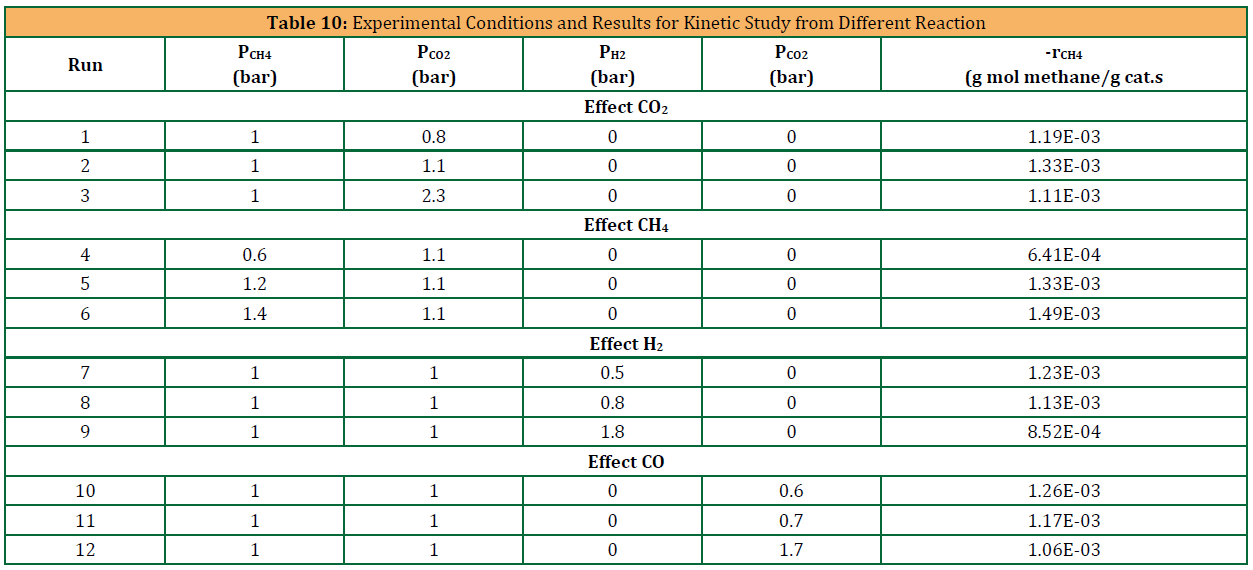
The rate law of the DRM on the Ni10Co9Mg1.6/NaA-Zeolite was determined from the differential reactor experiments. The experimental data is shown in Table 10. Table 10 indicates the rate of reaction of methane as a function of the partial pressure of carbon dioxide (CO2), methane (CH4), hydrogen (H2) and carbon monoxide (CO). A partial pressure of either CH4 or CO2 is kept constant while varying that of the other (He was used as make-up carrier gas to keep the same GHSV).
For this purpose, the reaction was assumed to be irreversible. The qualitative conclusion was analysed based on the experimental data (Table 10) to find the dependence of the rate of disappearance of methane on the partial pressure of methane, carbon dioxide, hydrogen and carbon monoxide. In 7th, 8th and 9th runs, it could be observed that the consumption rate of methane decreased with increasing concentration of hydrogen at fixed partial pressure of methane and carbon dioxide. A rate expression in which the hydrogen partial pressure appeared in the denominator could explain this dependency:
The decrease of the methane consumption rate with an increase in hydrogen partial pressure might be related to the adsorption of hydrogen into the zeolite surface and RWGS reaction.
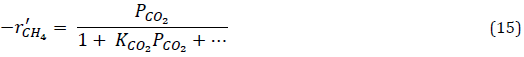
The effect of CO concentration was investigated in runs 10, 11 and 12. The data indicated that the consumption rate of methane did not depend on the CO partial pressure. As shows in a double increase in the pressure of carbon monoxide had little effect on -r’CH4. Consequently, it could be assumed that carbon monoxide was either very weakly adsorbed or went directly into the gas phase (Zhang et al., 2009). By referring to runs 1, 2 and 3 in Table 10, the data showed that the consumption rate of methane increased as the carbon dioxide concentration increased from 0.8 to 1.1 bar. However, the consumption rate of methane declined when the partial pressure increased to 2.3 bar. A form of the rate expression that would describe this behaviour which was shown as follows:
When examining the results from runs 4, 5 and 6, it could be seen that the rate increased linearly with increasing methane partial pressure and it could be qualitatively concluded that the reaction was first order in methane. In light of this fact, methane was either not adsorbed on the surface or its coverage of the surface was extremely low for the pressure used. If it was adsorbed, -r’CH4 would have a dependence on PCH4 analogous to the dependence of -r’CH4 on the partial pressure of carbon dioxide. Equation (16) was used for first-order dependence on CH4.

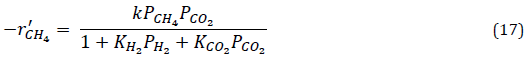
By combining all the equations (14)-(16), the overall rate law could be written as in equation (17) and the equation was in qualitative agreement with the data shown in Table 10.
3.4.2 Mechanism Consistent with Experimental Observations
In this part of discussion, the mechanism for the dry reforming of methane was proposed. In this particular reaction, dry reforming of methane on Ni10Co9Mg1.6/NaA-Zeolite was assumed to be surface-reaction-limited rather than adsorption- or desorption-limited. The reaction assumed that CO2 was adsorbed on the surface and then reacted with CH4 in the gas phase to produce benzene that was adsorbed on the surface and methane in the gas phase. The following equation showed the mechanism and associated rate laws for each elementary step:
CO₂ Adsorption:
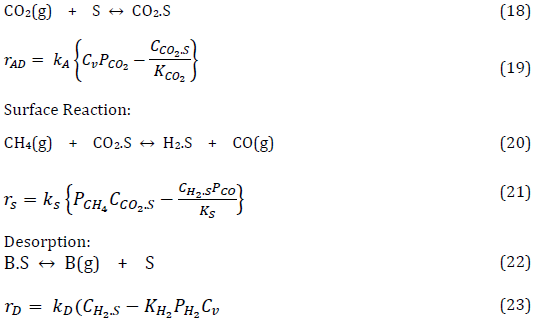
By referring to Equation (19), at equilibrium (rAD=0), then the equation could be simplified as
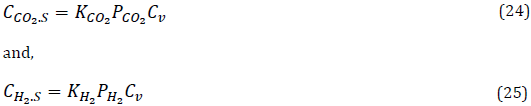
was simplified from Equation (23) by setting rAD=0 at equilibrium. Equation (26) was used to perform a site balance to obtain Cv:

replaced Equation (24) and Equation (25) into Equation (26) and rearranged to obtain the following equation;

Next, substituted for CCO2.S and CH2.S and then substituted for Cv in Equation (27) to obtain the rate law for the case of surface-reaction control:
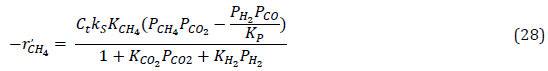
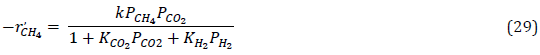
By neglecting reverse reaction, the final rate law for the dry reforming of methane on Ni9.67Co8.22Mg2.71/NaA-Zeolite was shown as follows:
3.4.3 Comparison with Existing Model
Data obtained from the differential mode kinetics experiments in Table 10 was used to fit with Power Law, Langmuir-Hinshelwood and Eley-Rideal models. A non-linear regression analysis on the data from Table 10 was carried out to determine which rate law best described the data. Polymath was chosen as the software package to solve this problem. The data in Table 10 were typed into the system. After entering the data, the result was obtained which was shown in Table 11.
The data from Table 10 were entered into Polymath nonlinear-least-squares. The model equation was:
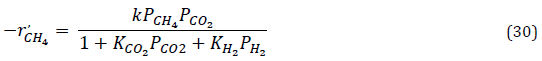
Figure 16 shows the parameters values after regression analysis using Polymath software.
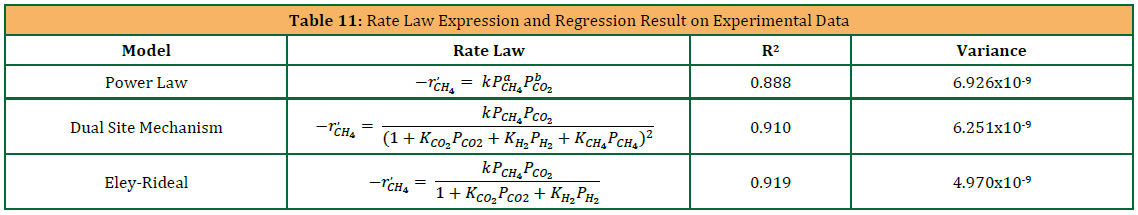
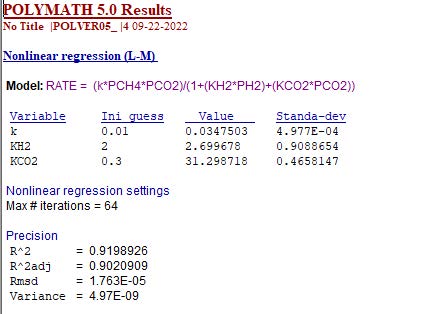
Figure 16: Polymath result on experiment data to evaluate the rate law parameters.
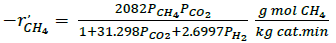
Converting the rate law to kilogram of catalyst and minutes:

to get the final form:
3.4.4 Apparent Activation Energy
The temperature sensitivity of the CH4 consumption rate over the Ni10Co9Mg1.6/NaA-Zeolite catalyst was investigated with the temperature range of 550-700°C. From this study, an Arrhenius plot could be obtained as shown in Figure 17. The Arrhenius plot allows obtaining the activation energy of CH4 consumption, CO2 consumption, H2 formation and CO. The activation energy of each species reaction rate is summarized in Table 12 and is compared with data published by others.
Since the activation energy barrier of CH4 consumption step was greater than that of CO2 consumption step, it could be assumed that the CH4 dissociation step could be the rate determining step in this study. The lower activation energy barrier for CO2 consumption might be caused by the presence of strong Lewis base of MgO which could facilitate the activation of CO2 [45]. In addition, the apparent activation energy barrier for H2 formation step was greater than that for the CO formation step. This indicated that the reverse water gas-shift (RWGS) reaction occurred during the CO2 reforming of CH4 process.
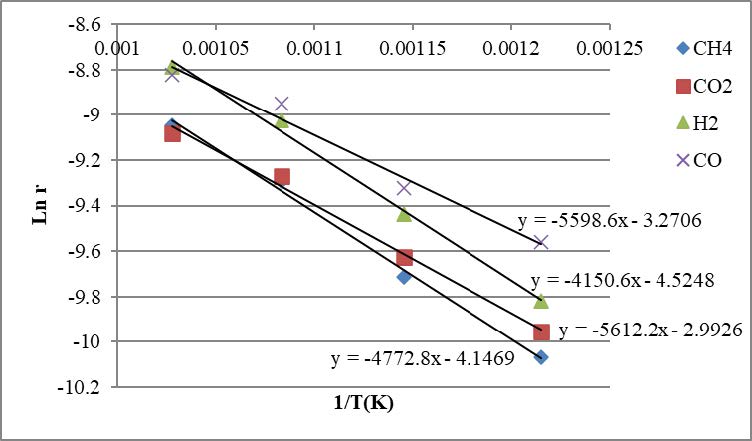
Figure 17: Arrhenius plot for CH4 consumption, CO2 consumption, H2 formation and CO formation.
Conclusion
In this present works, the catalyst for dry reforming of simulated biogas with the composition of 58% CH4 and 42% CO2 was successfully carried out by using newly formulated catalyst. The method of catalyst formulation in this research was based on response surface methodology (RSM) which aimed to reduce the time and cost consuming experiment. In conclusion, the BBD-RSM statistical analysis confirmed that the combination of NaA-zeolite, nickel metals, cobalt metal and magnesium metal could be used as catalyst for dry reforming reaction. In addition, with minimum experiments, the interaction between the variables was evaluated and discussed.
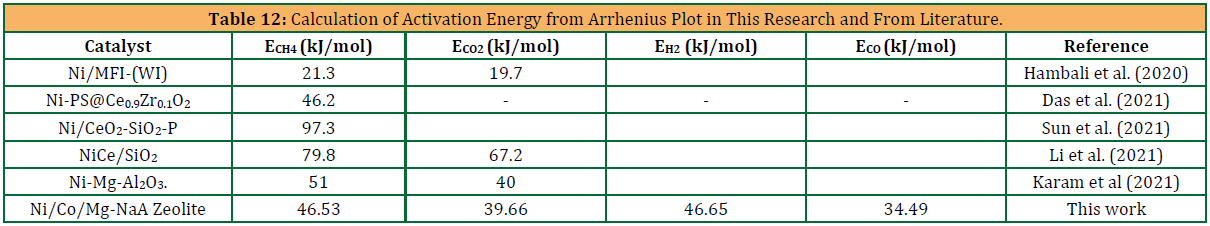
There were numbers of findings that could be concluded from the first part of the research. Firstly, the catalyst combination with NaA-zeolite could be used as DRM catalyst. However, at the tested condition, the production conversion was slightly low compared to equilibrium conversion. Secondly, the addition of secondary metal cobalt and promoter could improve the product conversion. From the catalytic reaction, at reaction temperature of 550°C, the methane conversion increased from 15% to 21% via the use of Ni10Co9Mg1.6/NaA-Zeolite compared to Ni10/NaA-Zeolite. The CO2 conversion also significantly changed from 25% to 34% by using Ni10Co9Mg1.6/NaA-Zeolite. The H2/CO ratio of Ni10Co9Mg1.6/NaA-Zeolite 0.9014 was close to 1. The alloy catalyst also increased the catalyst stability score from 0.709 to 0.805. It could be seen that the addition of active metals (Ni, Co and Mg) increased BET surface areas. This might be caused by the formation of metals agglomeration on the support surface. It could also be observed that the micropore surface area decreased with the addition of active metals due to pore filling of catalyst support. Lastly, the statistical analysis was used to determine the optimum formulation of catalyst. After the experiment confirmation, it could be concluded that the optimum formulation for catalyst was nickel loading percentage = 9.91%, cobalt loading percentage = 8.84%, and magnesium loading percentage = 1.62% with NaA-zeolite as support. The error between the simulation and experiments was less than 10 % for all responses.As the reaction condition, the kinetic and mechanism were also important for sizing and scale-up in a chemical process. Hence, the experimental works were used to evaluate the kinetic and mechanism studies of simulated biogas dry reforming over Ni10Co9Mg1.6/NaA-Zeolite catalyst. After going through confirmation with experimental data and comparison with existing kinetic model, the reaction mechanism could be explained by Eley Ridel model. The reaction occurred on the catalyst surface with CO2 being adsorbed on the catalyst surface and CH4 in gas phase. The temperature sensitivity of the CH4 consumption rate over the Ni10Co9Mg1.6/NaA-Zeolite catalyst was investigated in the temperature range of 550-700°C. The Arrhenius plot from the experimental data was used to obtain the activation energy of CH4 consumption, CO2 consumption, H2 formation and CO. From the data, the activation energy of CH4 consumption, CO2 consumption, H2 formation and CO were 46.53, 39.66, 46.65 and 34.49 kJ/mol respectively. The activation energy also indicated the existing of the RWSG side reaction.
Acknowledgements
Heartfelt thanks and appreciation go to all people who contributed to this research. Funding and technical support from University Malaysia Pahang (PRGS210358) and University College TATI also acknowledged.
References
- Abdullah, A.H., Mat, R., Somderam, S., Abd Aziz, A.S., and Mohamed, A., 2018. Hydrogen sulfide adsorption by zinc oxide-impregnated zeolite (synthesized from Malaysian kaolin) for biogas desulfurization. J. Ind. Eng. Chem., 65, Pp. 334–342. doi: https://doi.org/10.1016/j.jiec.2018.05.003.
- Álvarez, M.A., Bobadilla, L.F., Garcilaso, V., Centeno, M.A., and Odriozola, J.A., 2018. CO2 reforming of methane over Ni-Ru supported catalysts: On the nature of active sites by operando DRIFTS study. J. CO2 Util., 24, Pp. 509–515. doi: 10.1016/j.jcou.2018.01.027.
- Araiza, D.G., Arcos, D.G., Gómez-Cortés, A., and Díaz, G., 2021. Dry reforming of methane over Pt-Ni/CeO2 catalysts: Effect of the metal composition on the stability. Catal. Today, 360, Pp. 46–54. doi: 10.1016/j.cattod.2019.06.018.
- Aramouni, N.A.K., Zeaiter, J., Kwapinski, W., Leahy, J.J., and Ahmad, M.N., 2021. Trimetallic Ni-Co-Ru catalyst for the dry reforming of methane: Effect of the Ni/Co ratio and the calcination temperature. Fuel, 300, Pp. 120950. doi: 10.1016/j.fuel.2021.120950.
- Arbag, H., 2018. Effect of impregnation sequence of Mg on performance of mesoporous alumina supported Ni catalyst in dry reforming of methane. Int. J. Hydrogen Energy, 43 (13), Pp. 6561–6574. doi: 10.1016/j.ijhydene.2018.02.063.
- Ayodele, B.V., Khan, M.R., Lam, S.S., and Cheng, C.K., 2016. Production of CO-rich hydrogen from methane dry reforming over lanthania-supported cobalt catalyst: Kinetic and mechanistic studies. Int. J. Hydrogen Energy, 41 (8), Pp. 4603–4615. doi: 10.1016/j.ijhydene.2016.01.091.
- Bacariza, C., Karam, L., El Hassan, N., Lopes, J.M., and Henriques, C., 2022. Carbon Dioxide Reforming of Methane over Nickel-Supported Zeolites: A Screening Study. Processes, vol. 10, no. 7, 2022, doi: 10.3390/pr10071331.
- Bonmassar, N., 2020. In Situ-Determined Catalytically Active State of LaNiO3 in Methane Dry Reforming. ACS Catal., 10 (2), Pp. 1102–1112. doi: 10.1021/acscatal.9b03687.
- Chen, H., 2021. Structured silicalite-1 encapsulated Ni catalyst supported on SiC foam for dry reforming of methane. AIChE J., 67 (4), Pp. e17126. doi: https://doi.org/10.1002/aic.17126.
- Chen, S., Zaffran, J., and Yang, B., 2020. Dry reforming of methane over the cobalt catalyst: Theoretical insights into the reaction kinetics and mechanism for catalyst deactivation. Appl. Catal. B. Environ., 270, Pp. 118859. doi: https://doi.org/10.1016/j.apcatb.2020.118859.
- Das, S., Jangam, A., Xi, S., Borgna, A., Hidajat, K., and Kawi, S., 2020. Highly Dispersed Ni/Silica by Carbonization-Calcination of a Chelated Precursor for Coke-Free Dry Reforming of Methane. ACS Appl. Energy Mater., 3 (8), Pp. 7719–7735. doi: 10.1021/acsaem.0c01122.
- Duan, X., 2022. Nickel‒cobalt bimetallic catalysts prepared from hydrotalcite-like compounds for dry reforming of methane. Int. J. Hydrogen Energy, 47 (58), Pp. 24358–24373. doi: https://doi.org/10.1016/j.ijhydene.2022.05.211.
- Guharoy, U., Reina, T.R., Liu, J., Sun, Q., Gu, S., and Cai, Q., 2021. A theoretical overview on the prevention of coking in dry reforming of methane using non-precious transition metal catalysts. J. CO2 Util., 53, Pp. 101728. doi: https://doi.org/10.1016/j.jcou.2021.101728.
- Hambali, H.U., Jalil, A.A., Abdulrasheed, A.A., Siang, T.J., Gambo, Y., and Umar, A.A., 2022. Zeolite and clay based catalysts for CO2 reforming of methane to syngas: A review. Int. J. Hydrogen Energy, 47 (72), Pp. 30759–30787. doi: 10.1016/j.ijhydene.2021.12.214.
- Hambali, H.U., Jalil, A.A., Abdulrasheed, A.A., Siang, T.J., Owgi, A.H.K., and Aziz, F.A.F., 2021. CO2 reforming of methane over Ta-promoted Ni/ZSM-5 fibre-like catalyst: Insights on deactivation behavior and optimization using response surface methodology (RSM). Chem. Eng. Sci., 231, Pp. 116320. doi: 10.1016/j.ces.2020.116320.
- Han, J.W., Park, J.S., Choi, M.S., and Lee, H., 2017. Uncoupling the size and support effects of Ni catalysts for dry reforming of methane. Appl. Catal. B Environ., 203, Pp. 625–632. doi: 10.1016/j.apcatb.2016.10.069.
- Izhab, I., Asmadi, M., and Saidina Amin, N.A., 2021. Methane dry reforming using oil palm shell activated carbon supported cobalt catalyst: multi-response optimization,” Int. J. Hydrogen Energy, 46 (48), Pp. 24754–24767. doi: 10.1016/j.ijhydene.2020.04.188.
- Karam, L., 2020. Comprehensive study on the effect of magnesium loading over nickel-ordered mesoporous alumina for dry reforming of methane. Energy Convers. Manag., 225, Pp. 113470. doi: 10.1016/j.enconman.2020.113470.
- Karemore, A.L., Sinha, R., Chugh, P., and Vaidya, P.D., 2022. Syngas production by carbon dioxide reforming of methane over Pt/Al2O3 and Pt/ZrO2-SiO2 catalysts. Chem. Eng. Sci., Pp. 249. doi: 10.1016/j.ces.2021.117347.
- Khairudin, N.F., Mohammadi, M., and Mohamed, A.R., 2021. An investigation on the relationship between physicochemical characteristics of alumina-supported cobalt catalyst and its performance in dry reforming of methane. Environ. Sci. Pollut. Res., 28 (23), Pp. 29157–29176. doi: 10.1007/s11356-021-12794-0.
- Khan, M.U., 2021. Current status of biogas upgrading for direct biomethane use: A review. Renew. Sustain. Energy Rev., 149, Pp. 111343. doi: https://doi.org/10.1016/j.rser.2021.111343.
- Khoja, A.H., Tahir, M., and Saidina Amin, N.A., 2019. Process optimization of DBD plasma dry reforming of methane over Ni/La2O3[sbnd]MgAl2O4 using multiple response surface methodology. Int. J. Hydrogen Energy, 44 (23), Pp. 11774–11787. doi: 10.1016/j.ijhydene.2019.03.059.
- Kim, W.Y., Jang, J.S., Ra, E.C., Kim, K.Y., Kim, E.H., and Lee, J.S., 2019. Reduced perovskite LaNiO3 catalysts modified with Co and Mn for low coke formation in dry reforming of methane. Appl. Catal. A Gen., 575, Pp. 198–203. doi: 10.1016/j.apcata.2019.02.029.
- Kweon, S., Kim, Y.W., Shin, C.H., Park, M.B., and Min, H.K., 2022. Nickel silicate beta zeolite prepared by interzeolite transformation: A highly active and stable catalyst for dry reforming of methane. Chem. Eng. J., 431, Pp. 133364. doi: https://doi.org/10.1016/j.cej.2021.133364.
- Li, B., Yuan, X., Li, B., and Wang, X., 2020. Impact of pore structure on hydroxyapatite supported nickel catalysts (Ni/HAP) for dry reforming of methane. Fuel Process. Technol., 202, Pp. 106359. doi: https://doi.org/10.1016/j.fuproc.2020.106359.
- Liang, D., 2023. Dry reforming of methane for syngas production over attapulgite-derived MFI zeolite encapsulated bimetallic Ni-Co catalysts. Appl. Catal. B Environ., 322, Pp. 122088. doi: https://doi.org/10.1016/j.apcatb.2022.122088.
- Littlewood, P., 2016. Low Temperature Dry Reforming of Methane with Nickel Manganese Oxide Catalysts.
- Meshksar, M., Kiani, M.R., Mozafari, A., Makarem, M.A., and Rahimpour, M.R., 2021. Promoted Nickel–Cobalt Bimetallic Catalysts for Biogas Reforming. Top. Catal., doi: 10.1007/s11244-021-01532-y.
- Morales, F., Anzures, 2021. Synthetic gas production by dry reforming of methane over Ni/Al2O3–ZrO2 catalysts: High H2/CO ratio. Int. J. Hydrogen Energy, 46 (51), Pp. 26224–26233. doi: https://doi.org/10.1016/j.ijhydene.2021.05.073.
- Myltykbayeva, L.K., 2020. Effect of cobalt oxide content on the activity of nio-co2 o3 /γ-al2 o3 catalyst in the reaction of dry reforming of methane to synthesis gas. Eurasian Chem. J., 22 (3), Pp. 187–195. doi: 10.18321/ectj978.
- Najfach, A.J., Almquist, C.B., and Edelmann, R.E., 2021. Effect of Manganese and zeolite composition on zeolite-supported Ni-catalysts for dry reforming of methane. Catal. Today, 369, Pp. 31–47. doi: https://doi.org/10.1016/j.cattod.2020.07.058.
- Nisa, K.S., 2022. Effect of base promoter on activity of MCM-41-supported nickel catalyst for hydrogen production via dry reforming of methane. Int. J. Hydrogen Energy, 47 (55), Pp. 23201–23212. doi: 10.1016/j.ijhydene.2022.05.081.
- Park, G., Kang, J., Park, S.J., Kim, Y.T., Kwak, G., and Kim, S., 2022. Effect of acid modification of ZSM-5 catalyst on performance and coke formation for methanol-to-hydrocarbon reaction. Mol. Catal., 531, Pp. 112702. doi: https://doi.org/10.1016/j.mcat.2022.112702.
- Rezaei, R., Moradi, G., and Sharifnia, S., 2019. Dry Reforming of Methane over Ni-Cu/Al2O3 Catalyst Coatings in a Microchannel Reactor: Modeling and Optimization Using Design of Experiments. Energy and Fuels, 33 (7), Pp. 6689–6706. doi: 10.1021/acs.energyfuels.9b00692.
- Shamsuddin, M.R., 2021. Insight into CO2 reforming of CH4 via NiO/dolomite catalysts for production of H2 rich syngas. Int. J. Energy Res., 45 (10), Pp. 15463–15480. doi: https://doi.org/10.1002/er.6816.
- Song, H.S., 2010. CH4 Reforming for Synthesis Gas Production over Supported Ni Catalysts. UWSpace.
- Sun, Y., Zhang, G., Cheng, H., Liu, J., and Li, G., 2021. Kinetics and mechanistic studies of methane dry reforming over Ca promoted 1Co–1Ce/AC-N catalyst. Int. J. Hydrogen Energy, 46 (1), Pp. 531–542. doi: 10.1016/j.ijhydene.2020.09.192.
- Taherian, Z., Khataee, A., and Orooji, Y., 2021. Nickel-based nanocatalysts promoted over MgO-modi fi ed SBA-16 for dry reforming of methane for syngas production: Impact of support and promoters. J. Energy Inst., 97, Pp. 100–108. doi: 10.1016/j.joei.2021.04.005.
- Wang, H., Dong, X., Zhao, T., Yu, H., and Li, M., 2019. Dry reforming of methane over bimetallic Ni-Co catalyst prepared from La(CoxNi1-x)0.5Fe0.5O3 perovskite precursor: Catalytic activity and coking resistance. Appl. Catal. B Environ., 245, Pp. 302–313. doi: 10.1016/j.apcatb.2018.12.072.
- Wu, L., Xie, X., Ren, H., and Gao, X., 2019. A short review on nickel-based catalysts in dry reforming of methane: Influences of oxygen defects on anti-coking property. in Materials Today: Proceedings, 42, Pp. 153–160. doi: 10.1016/j.matpr.2020.10.697.
- Wysocka, I., Hupka, J., and Rogala, A., 2019. Catalytic Activity of Nickel and Ruthenium–Nickel Catalysts Supported on SiO2, ZrO2, Al2O3, and MgAl2O4 in a Dry Reforming Process. Catalysts, 9 (6), doi: 10.3390/catal9060540.
- Yusuf, M., Farooqi, A.S., Alam, M.A., Keong, L.K., Hellgardt, K., and Abdullah, B., 2022. Response surface optimization of syngas production from greenhouse gases via DRM over high performance Ni–W catalyst. Int. J. Hydrogen Energy, 47 (72), Pp. 31058–31071. doi: 10.1016/j.ijhydene.2021.05.153.
- Zhang, J., Wang, H., and Dalai, A.K., 2009. Kinetic Studies of Carbon Dioxide Reforming of Methane over Ni−Co/Al−Mg−O Bimetallic Catalyst. Ind. Eng. Chem. Res., 48 (2), Pp. 677–684. doi: 10.1021/ie801078p.
- Zhang, Q., 2018. Hollow hierarchical Ni/MgO-SiO2 catalyst with high activity, thermal stability and coking resistance for catalytic dry reforming of methane. Int. J. Hydrogen Energy, 43 (24), Pp. 11056–11068. doi: https://doi.org/10.1016/j.ijhydene.2018.05.010.
- Zhao, X., Joseph, B., Kuhn, J., and Ozcan, S., 2020. Biogas Reforming to Syngas: A Review. iScience, 23 (5), Pp. 101082. doi: https://doi.org/10.1016/j.isci.2020.101082.
| Pages | 60-76 |
| Year | 2023 |
| Issue | 1 |
| Volume | 7 |
