
THE USE OF WATER QUALITY INDICES IN EVALUATING THE TAP WATER QUALITY: THE CASE OF AL-BAQA’A REFUGEE CAMP, JORDAN
Journal: Water Conservation and Management (WCM)
Author: Marwa A. Izmeqna, Shadi Moqbel
Print ISSN : 2523-5664
Online ISSN : 2523-5672
This is an open access article distributed under the Creative Commons Attribution License CC BY 4.0, which permits unrestricted use, distribution, and reproduction in any medium, provided the original work is properly cited
Doi: 10.26480/wcm.01.2024.79.86
Abstract
 Many people find tap water unsatisfactory for their daily consumption, despite the fact that suppliers are required to provide high-quality water to the public. Water quality indices that were developed to assess the water quality of water bodies are sometimes used to assess water in distribution networks. The use of the water quality indices Weighted Arithmetic (WA) and the Canadian Council of Ministers of the Environment (CCME) methods in describing the tap water quality status at Al-Baqa’a camp is evaluated in this study. Forty samples were collected over four rounds from ten households. The study concluded that the water supplied to the study area was safe but was subjected to a later irregular localized biological contamination. The analysis of water constituents revealed that both indices provide generalized descriptions that do not accurately represent the current state of tap water quality. The study proposed using a two-index system comprised of WQI at the network pumping location and a contamination threat index to study tap water quality. Applying the two indices system at Al-Baqa’a Camp tap water showed that water supplied to the area is safe but it has a localized biological contamination potential of 23.7%
Keywords
Water Quality Index, drinking water, distribution network, contamination threat index
1. INTRODUCTION
When compared to bottled water, the quality of tap water has been debated among communities. The primary motivators for switching to bottled water are health and safety concerns, organoleptic properties, marketing, and lifestyle (Debbeler et al., 2018). The marketing and convenience of carrying water bottles have earned water bottles the people’s trust. Consequently, the consumption of bottled water continues to rise, contributing to global plastic pollution (Geerts et al., 2020). Globally, about 600 billion plastic bottles are produced, delivering approximately 350 billion liters of water while creating about 25 million tons of plastic waste (Bouhlel et al., 2023). When considering the environmental impact, associated carbon emission, and manufacturing expenses, tap water remains the more cost-effective and environmentally friendly choice (Horowitz et al., 2018).
The drinking water quality, whether it is tap or bottled, varies depending on the source from which it was drawn, the treatment it received, and being subjected to natural or anthropogenic contamination (Al-Amoush et al., 2018; Dwivedi, 2020). Furthermore, the consistency of treatment and the monitoring practiced by suppliers and stakeholders determine the dependability of water quality for any source (Al-Farajat and Salameh, 2010). Contamination of tap water can occur while being conveyed through faulty networks or while being temporarily stored for later consumption. Bottled water can become contaminated while being filled or stored. Storage of bottled water for a long period can cause contamination with antimony leaching Polyethylene Terephthalate (PET) from the packaging material (Shotyk and Krachler, 2007).
Therefore, filling water into bottles does not mean they have better quality than tap water (Doria, 2006).
Determining the safety and trustworthiness of water sources necessitates regular evaluation of water quality at the point of consumption. Water quality evaluation is described by monitoring water parameters (physical, chemical, and microbiological) and identifying the parameters that exceed acceptable limits (Galal-Gorchev, 1993). Various approaches have been proposed to assess water quality, one of which is the Water Quality Index (WQI), which is widely used for water quality assessment (Ibrahim, 2018). The Water Quality Index (WQI) represents a powerful tool that summarizes the collected parameters from water tests into a single number that symbolizes the overall quality of water instead of multiple water parameters so that the general public can understand and use it (Kumar and Dua, 2010; Dutta and Sarma, 2018; Dwivedi, 2020).
Several indices have been used for the assessment of water quality, such as the Weighted Arithmetic Water Quality Index (WA-WQI), the Canadian Water Quality Index (CWQI), Oregon Water Quality Index (O-WQI) Index, the Canadian Council of Ministers of Environment Water Quality Index (CCMEWQI), and the National Sanitation Foundation Water Quality Index (NSF-WQI) (Ravikumar et al., 2013; Kachroud et al., 2019). These indices have been used by many international organizations and countries to assess water quality of water sources such as groundwater, lakes, streams, and rivers, and then they were used to assess bottled water and water in inhabited areas (Pei-yue et al., 2010; Yadav et al., 2010; Damo and Icka, 2013; Toma et al, 2013; Sharma and Choudhary, 2014; Akter et al., 2016; García-Ávila et al., 2022).
The use of water quality indices for evaluating water quality has helped in understanding the water resource conditions and their suitability for domestic and recreational use. They were also used to indicate the water quality at different locations in the distribution network (Al-Omran et al., 2015; El-Naqa and Al Raei, 2021). Nevertheless, the use of a water quality index for evaluating water quality at consumption points might not be accurate because the water pumped into the network has to be safe and suitable for consumption, but it could become contaminated later on. Also, contamination incidents tend to be limited to small areas. Therefore, generalizing the results from contaminated areas to the entire distribution zone is inaccurate. Hence, it is necessary to compare and evaluate the fitness of water quality indices to represent water quality at consumption points.
Jordan is considered a water-scarce country among other countries around the world; where the high rate of population growth in addition to the influx of refugees from the crisis-affected countries resulted in a huge water deficit between water supply and demand (Nortcliff, 2008; Hadadin et al., 2010). While water supply is continuous in water-rich countries, Jordan’s authorities were forced to rely on intermittent supply due to a water shortage. Water is distributed to the people once or twice a week. As a result, people rely on water storage tanks on the roofs of their buildings or on a system of two storage tanks and a pump, in which water is delivered to a storage tank at the bottom of the building and then privately pumped to another storage tank on the roof of the building. The sizes of these tanks are intended to meet the water needs for at least a week.
The quality of water distributed to the people in Jordan is generally high and complies with the WHO drinking water guideline values as well as Jordanian allowable limits (Properzi, 2010). Nevertheless, bottled water demand has increased continuously over the last two decades, and some people have installed filtration units in their tap water network rather than using regular tap water or bottled water. Several incidents of drinking water contamination with sewerage have been reported over the last decade at Al-Baqa’a Refugee Camp in Jordan. The incidents prompted camp residents to switch from drinking water to bottled water, putting a financial strain on the Refugee Camp’s families. The growing number of contamination incidents and the expansion of the bottled water industry raised serious concerns about the safety of tap water and its suitability as a reliable source.
This research aims to evaluate the use of two water quality indices, WA-WQI and CCMEWQI, at the user end at Al-Baqa’a Refugee Camp. Therefore, the objectives of this study are to identify the parameters that exceed allowable limits and national standards, to recognize the possible causes of water contamination, to assess the tap water quality at the user end, and to evaluate the work of the two indices in representing water quality in the study area. The significance of this study is demonstrated by elucidating the extent to which water quality indices can be used for tap water quality testing, presenting actual tap water quality conditions, and determining an appropriate method to represent tap water quality. This study is expected to raise community awareness through the involvement of relevant authorities, committees, and non-governmental organizations (NGOs).
2. MATERIALS AND METHODS
2.1 Study Area
The study area is the Al-Baqa’a Refugee camp, which is one of the ten “emergency camps” in Jordan, which was set up in 1968 to accommodate Palestinian refugees and displaced persons, as a result of the Arab-Israeli war. The camp is located 20.0 km to the northwest of Amman and sits along the South-North Highway, which connects Amman to Jordan’s northern cities, as indicated in Figure 1. Al Baqa’a camp is the largest of Jordan’s ten official camps. The camp has an area of around 1.49 km2, with a total population of more than 131,630 m2 (UNRWA, 2023). Figure 1 shows the boundary of the camp, and an aerial view of Al Baqa’a camp, demonstrating the density of buildings in the camp in comparison to the surrounding area.
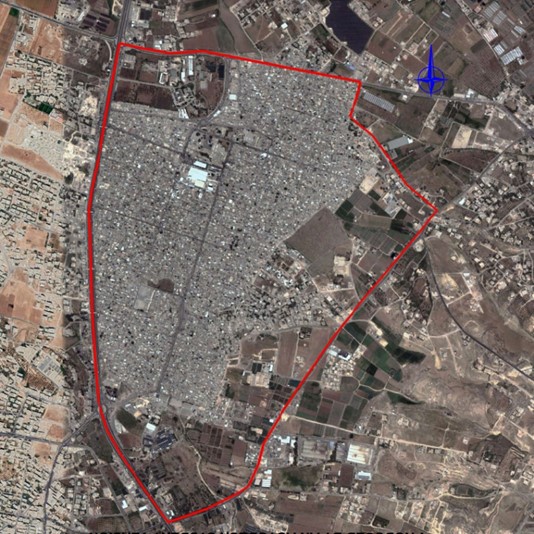
Figure 1: Arial view of Al Baqa’a camp (Google Earth, 2021)
The primary water source for the camp area is a 2000 m3 ground tank (Al-Baqa’a Reservoir No. 20) located to the southeast of the camp, which is being supplied from three resources where they are mixed before pumping:
•Dabouq Reservoir.
•Abu Nuseir ground water Wells.
•Ain Al Basha ground water Wells.
The water supply pattern in the camp is intermittent pumping, each neighborhood is provided with water from the reservoir three days per week. However, due to the high population density, each household receives water one day per week. The water obtained from the aforementioned resources has already been disinfected using chlorine. However, the water of Al Baqa’a Reservoir No.20 is chlorinated once more before it is distributed to the camps’ households.
2.2 Sampling
Tap water samples were collected from homes in 1.0 L plastic bottles for the physiochemical tests and 250 ml dark glass bottles for the biological tests. The Canadian Council of Ministers for the Environment (CCME, 2001) recommends that a water quality index shall not be calculated for a station with fewer than four parameters and four sampling visits per year, this is known as the “Four by Four” (4×4) rule. The samples were collected from ten households on four rounds during April and May 2021. Due to the intermittent supply pattern adopted by the water authorities in Jordan, the water is delivered to the camp for one day per week. The samples were collected on Saturdays to ensure consistency in sampling collection. The sampling dates were April 3rd, April 10th, April 17th, and May 1st, 2021. The samples were kept in cold and dark containers in order to be transported to the laboratory for testing. The sampling locations were chosen to cover the entire camp area as indicated in Figure 2. The ten households were selected randomly for sample collection and with the approval of household owners.
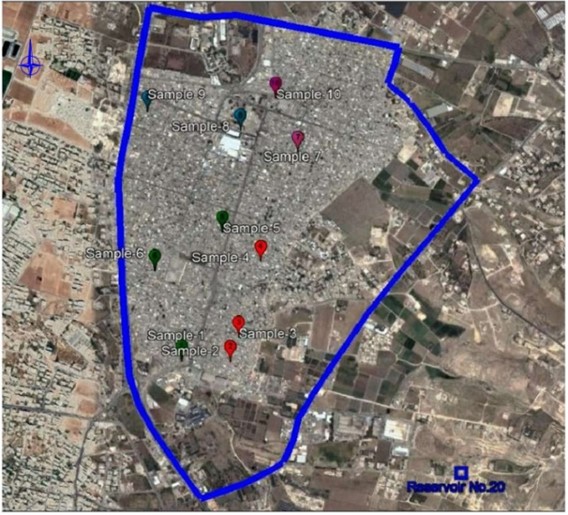
Figure 2: Sampling Locations (Households), (Google Earth, 2021)
2.3 Water Quality Parameters
Selecting the water quality parameters for testing is crucial for the water quality evaluation (Chen et al., 2022). Due to time constraints, the cost of the laboratory tests, and the lack of resources, it is generally impossible to monitor all water quality variables. Therefore, only the most essential variables are monitored. The CCME recommended that WQI values should be calculated using at least four parameters sampled at least four times per year (CCME, 2001). However, a recent review revealed that a larger number of parameters (a minimum number of eight) gives a more accurate and reliable value for WQI (Tri-Star Environmental Consulting, 2012).
On the other hand, the National Sanitation Foundation (NSF) recommended 11 parameters to be used in the calculation of WQI including; temperature, dissolved Oxygen (DO), Fecal Coliform (FC), pH, Biochemical-Oxygen demand (BOD5), total phosphorus, Nitrate (NO3-), Turbidity, Total Dissolved Solids (TDS) and Toxic compounds (Sutadian et al., 2016). In this research, BOD5 was not chosen because treated drinking water must not include organics. Therefore, ten physical, chemical, and biological parameters are selected for the analysis, which are pH, TDS, Total Hardness, Turbidity, Cl, F, Na, NO3, Total Coliform, and Escherichia coli. These are the commonly used parameters in the calculation of WQI, which were commonly found in the literature for testing tap water.
2.4 WQI Calculations
The water quality index was assessed using two methods:
2.4.1 The Weighted Arithmetic WQI
In this method, the index was calculated by following four steps as described by Brown et al (1970):
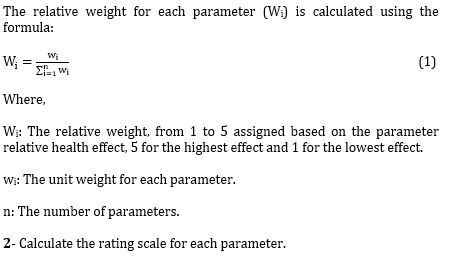
1- Assignment of unit weight and calculation of the relative weight for each parameter.
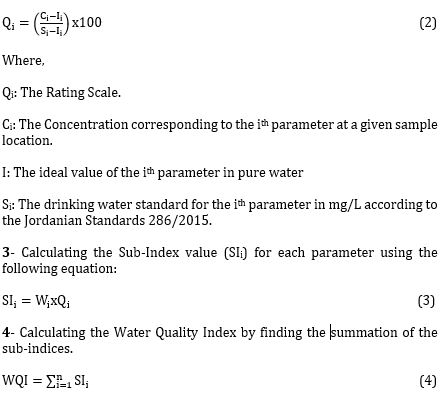
The rating scale converts the various units and dimensions of water quality parameters to a single scale. Each parameter’s rating scale (Qi) is calculated by dividing its concentration by its permissible limit value as defined in the Jordanian standard JS286/2015, and then multiplying the result by 100 using the following equation:
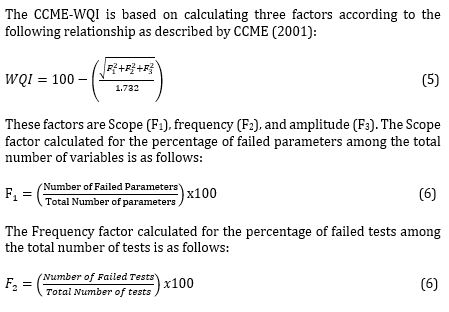
2.4.2 Canadian Council of Ministers of the Environment Water Quality Index (CCME-WQI)
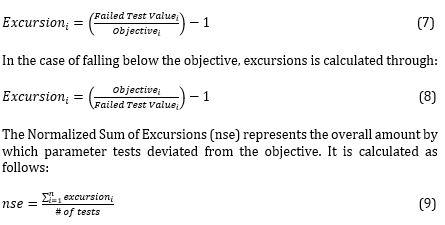
The Amplitude factor calculates the amount by which failed tests deviate from the desired objective. It is calculated through the values of Excursion and the normalized sum of excursions (nse). The term Excursion stands for the number of times a parameter deviated from the objective as follows. In the case of exceeding the objective, excursion is calculated through:

3. RESULTS AND DISCUSSION
3.1 Water Quality Parameters Tests
The sampling procedure resulted in collecting forty tap water samples. Out of the forty tested samples, concentrations in two samples were extremely low. The physiochemical results in these samples were two orders of magnitude smaller than the remaining samples indicating inappropriate testing. Therefore, they were rejected as outliers. These samples were sample S1 from the first round and sample S9 from the fourth round. Accordingly, the values of these samples were excluded from the statistical analysis and the calculations of the WQI. The obtained physicochemical parameters’ average values were compared to the Jordanian standards for drinking water (JS 286/2015). Table 1 shows descriptive statistics of the 38 samples collected in this study. Test results for each sampling round are presented in Table 2. In general, the data in Tables 1 and 2 show that all physiochemical parameters of tap water at the user end were within allowable limits, and none of the physiochemical samples registered higher than the maximum allowable value according to Jordanian standards.
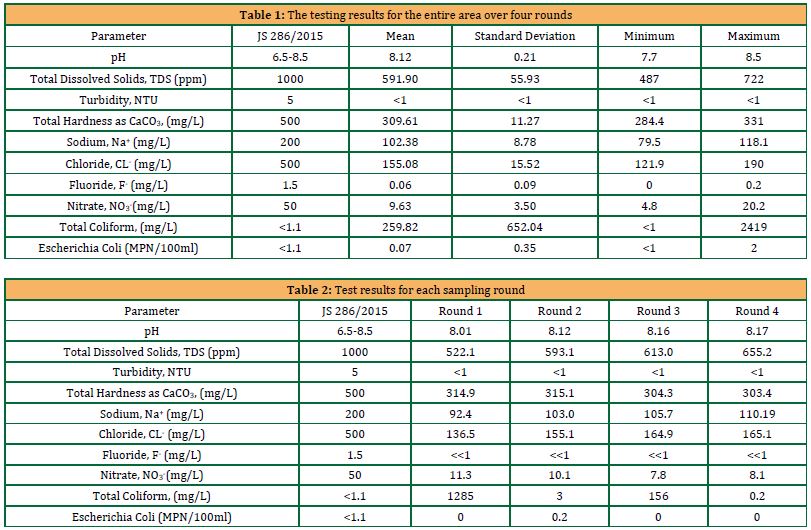
According to the JS286/2015, the coliform bacteria should not be more than 1.10 MPN/100ml. Non-zero values were detected in eight samples along with the study duration, the highest value was recorded in sample S5 in the first round 2419 MPN/100ml. Also during the first round, sample S8, which was distant from S5, had a value of 151.5 MPN/100ml. In the second round, total coliform was detected in sample S4 only with a value of 30.9 MPN/100ml. In the third round, total coliform was detected in four samples. The highest value was 1553.07 MPN/100ml in sample S1, while samples S2, S8, and S9 registered lower values of 2.0 MPN/100ml, 2.0 MPN/100ml, and 5.2 MPN/100ml, respectively. In the fourth round, total coliform was detected in only one sample S10 with a value of 2.0 MPN/100ml. All of the non-zero samples revealed that the water of these households is contaminated and considered unsuitable for drinking. Although total coliform was observed in eight samples, E. coli was detected in one sample only, S4 from the second round, during the duration of the study and recorded at 2.0MPN/100ml.
As the sampling results represent the water quality at the user end, it was essential to obtain information on the water quality before distribution to households. Therefore, the study acquired the Water Authority of Jordan (WAJ) records on the water quality for Al Baqa’a Reservoir No. 20, the main water supplier to the Al-Baqa’a camp area. The water quality results as supplied by WAJ are presented in Table 3.
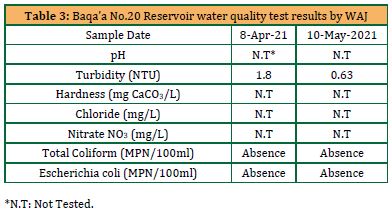
The results obtained from WAJ for the reservoir water quality tests were compared to the results of the field tap water tests of the camp. The measured Turbidity of the reservoir water was 1.80 and 0.63 NTU on the tested dates. The obtained data shows that the turbidity was higher than standards on the first test then it dropped on the second test to within the Jordanian drinking standards. During the study duration, all of the tap water samples recorded a value of less than one for turbidity. The decrease in turbidity could be related to the settling effect of household storage tanks. The physiochemical results show that water delivered to consumers is of high quality and there are no signs of physiochemical contamination. Conversely, the biological properties show wide variation. The results from WAJ show no biological contamination was found in the reservoir’s water, which also conforms to the Jordanian water standards. Also, some households’ tap water showed no presence of any biological agents. The difference in biological test results shows a biological contamination occurring on a small scale either in the network or at the storage tanks of the end-user.
When looking further into the results, we find that the contamination is sporadic and inconsistent. The coliform bacteria were detected in some locations in the first round and then disappeared in the next one, and was detected again in the third round like in sample S8. In comparison, other samples registered a non-zero value only once during the whole study duration, like samples S2, S4, and S5. The disparity in biological contamination between regions supplied by the same source without affecting the physiochemical properties of the water indicates that contamination is not caused by wide contamination in the network. Another explanation for the contamination can be at the household storage. A common practice among the people in Jordan is leaving the water storage tanks open to the air without a cover or with the cover open. Leaving the water storage tank open makes the water accessible to birds and pets. Consequently, it becomes susceptible to contamination by the birds’ or cats’ feces, or even creating sort of death traps for birds. Furthermore, the presence of E.coli in the water is a strong indication that water is contaminated with human or animal waste, which strengthens the likelihood of contamination by animals’ access to the storage tank. Moreover, upon asking the residents about the frequency of cleaning their rooftop water tanks, their answers varied from performing seasonal cleaning to irregular cleaning to never.
3.2 Water Quality Index Generation
The ten parameters analyzed previously were used to estimate the (WQI) for tap water at Al-Baqa’a Refugee Camp, where the WQI was calculated for each round individually. In this study, the water quality index (WQI) was calculated using two methods:
A.Weighted Arithmetic (WAWQI).
B.The Canadian Council Water Quality Index (CCME-WQI).
3.2.1 WA-WQI
Calculation of the WA-WQI used the weighted average physiochemical parameters for each round and for the entire study period. Each of the ten parameters has been assigned a weight (wi) ranging between one and five based on the health impacts it has when present in drinking water, as indicated (Ibrahim, 2019). Accordingly, the rating scale (Qi) and the sub-index (Si) are calculated for each measured parameter in each household and then used for estimating the WA-WQI. The values for the WA-WQI for each round and the entire study period are shown in Table 4. Due to the microbial data analysis and contamination of tap water inside the vicinity of the household, two scenarios were adopted to calculate the WQI: WQI including microbiological parameters and WQI without microbiological parameters, as indicated in Table 4.
The water quality classification according to the WQI was determined for both scenarios using the classification adopted by (El-Naqa and Al Raei, 2021). The classification describes drinking water with WA-WQI of less than 50, 50-100, 100-200, 200-300, and more than 300 as Excellent, Good, Poor, Very Poor, and Unsuitable for drinking, respectively. These categories of water indicate the possible uses of the water depending on its WQI. Excellent water indicates that the water is suitable for Drinking, Irrigation, and Industrial uses, Good means that the water is suitable for Domestic, Irrigation, and Industrial uses, water classified as Poor is suitable for Irrigation and Industrial uses, while Very poor water is restricted to irrigation uses only, and when the classification is Unsuitable for drinking then a treatment required before irrigation (Karim et al., 2019).
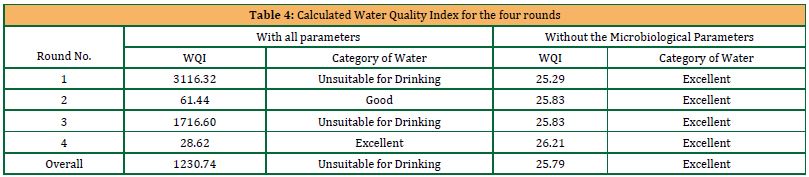
A considerable variation was found in the calculated WQI in the two scenarios. In the first scenario, when all parameters are included in the WQI calculation, the larger value for the index was found in round one by 3116.32, and the water is classified as “Unsuitable for Drinking”. This high value of WQI is caused by the high value of total coliform, which was measured in samples S5 and S8 by 2419 MPN/100ml and 151.5 MPN/100ml, respectively. WQI in round three comes in the second rank 1716.60, and the water is classified again as “Unsuitable for drinking”, where the high value of total coliform by 1553.07 MPN/100ml was observed in sample S1. Notably, the calculated WQI in round two was below 100 and the water was categorized as “Good”; similarly, round four’s WQI was below 50 and the water was categorized as “Excellent”. The overall assessment for the four rounds using WA-WQI was “Unsuitable for drinking”. On the other hand, the values of the WQI that are calculated without the Microbiological parameters are 25.29, 25.83, 25.83, and 26.21, which are less than 50, and according to the classification, the water is classified as “Excellent water” in the four rounds. Consequently, the overall assessment for the four rounds in the second scenario is “Excellent”.
3.2.2 CCME-WQI
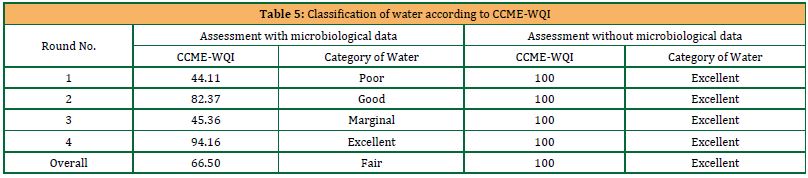
The second method used for measuring the WQI is the one used by the Canadian Council of Ministers of the Environment; two scenarios were also used to calculate the WQI in this method; with and without the microbiological parameters. The results for CCME-WQI calculations are presented in Table 5. Based on the calculated CCME-WQI, the water is classified into five categories: Excellent, Good, Fair, Marginal, and Poor for WQI between 95-100, 80-94, 65-79, 45-64, and 0-44, respectively.
These WQI categories of water can be interpreted as follows: Excellent means Water quality is mostly unaffected or not impaired, resulting in very similar situations to natural or pristine levels, while Good Water quality is safeguarded with only limited risk or impairment; conditions rarely deviate from natural or optimal levels, on the other hand, Fair indicates that the Water is normally protected, but it can be threatened or harmed on rare occasions; conditions can infrequently deviate from natural or desired levels, while Marginal water quality is frequently threatened or impaired; conditions often depart from natural or desirable levels, and Poor water quality is almost always threatened or impaired; conditions usually depart from natural or desirable levels (CCME, 2001).
The CCME-WQI is calculated by finding the three variables F1, F2, and F3, which represent the Scope, the Frequency, and the Amplitude of failed tests, respectively. The calculated CCME-WQI for each round and the corresponding category of water for each round are specified in Table 5. The results show that the WQI of the camp in the first round is 44.11, and the water is classified as “Poor water” in the second round, the water is “good”, while in the third and fourth rounds, the water is classified as “Marginal” and “Excellent”, respectively. The average WQI of the camp is 66.50, which categorizes the water as “Fair”. In comparison, the WQI calculated without the microbiological parameters was 100 in each round of the four rounds of the study duration, and the water is classified as “Excellent” since all the physiochemical parameters are below the maximum permissible values.
3.2.3 Comparing indices results
Comparing the water quality according to both indices considering all parameters reveals an agreement between the two scales in rounds 2 and 4 i.e. when the water conforms to the standards and is considered of an excellent or good quality. For rounds 1 and 3, the WA-WQI scale concluded that the water is unsuitable for drinking while CCME-WQI concluded that the water quality is at high risk. The scales diverged on the overall assessment. While the WA-WQI considered the water unsuitable for drinking, the CCME-WQI considered it of fair quality. On the other hand, both scales agreed on considering the water of excellent quality when ignoring the biological parameters.
The contamination case observed in this study raises a note that should be considered in further detail while estimating water quality indices for tap water, especially in conditions of intermittent supply and relying on household storage of water. Although high-quality tap water is supplied through distribution networks to lots of households, water is sometimes contaminated close to or inside the household’s vicinity.
Concluding that the tap water is poor, marginal, and unsuitable for drinking is an exaggeration and does not present the actual condition accurately. While the water that was pumped into the network and received by many households was of high quality, the results from the locations that have local contamination issues influenced the judgment severely. According to the WA-WQI, the tap water in the first week and the third week was considered unsuitable for drinking although the supplied water was conforming to the Jordanian drinking water standards.
The way that the weighted arithmetic works does not consider the localities of problems. It averages the data and generalizes the results to all. In the first round, contamination incidents in 2 locations were registered while the remaining locations had safe tap water. In the third round, three low-contamination and one high-contamination incidents were registered while the remaining locations had safe tap water. Generalizing the results from contaminated sites to conclude the entire served area is not accurate. Such an idea might work in the case of drawing water from a single source or one water body. In the case of water distribution networks, especially in the hierarchy distribution system, using this method seems erroneous. It might be conservatively assumed an indicator of tap water quality in the case that there is no sufficient information on the network or the household’s storage tank, but such a conclusion should not be generalized when some households’ water tanks are subjected to negligence, or at least water suppliers should not be blamed for it. Facing the public with conclusions based on such results might cause legal issues.
The water quality index presented by CCME-WQI presented a less severe and more realistic judgment on the water quality than WA-WQI. According to the categories associated with CCME-WQI, the assessment of poor water for the first round indicates that the tap water is always threatened or impaired. The assessment of the third round according to CCME-WQI showed that the tap water is marginal, which translates to frequently threatened or impaired. The assessment of CCME-WQI is based on calculating several parameters relying on the number of failed tests relative to the total number of tests. Therefore, the results are more realistic than the WA-WQI. Nevertheless, the CCME-WQI put a general classification to the tap water without describing the actual problem.
Determining the level of tap water safety for consumption use using these two indices is indefinite. While the CCME-WQI is more realistic than WA-WQI in describing the contamination incidents, the result is still generalizing a limited number of failing tests and small-scale contamination incidents on the water quality delivered by the distribution network. The water pumped into the network and delivered to many locations was safe and had high quality for consumption. Nevertheless, small-scale anthropogenic activities and inadequate storage and maintenance within the household vicinity resulted in lowering the water quality before consumption. Therefore, relying on the water quality indices alone might not be the optimum solution to determine the suitability of tap water for consumption use. Including other factors that address the contamination incidents can be more reasonable. This result conforms with the conclusions of (García-Ávila et al., 2022)
3.3 Two indices system
The study suggests introducing a safety system that is composed of two indices; the water quality index and the contamination threat index. In this system, the water quality index is specified to the water quality before pumping into the distribution network, while the contamination threat index is set to the probability of water quality failure at the consumption point. The contamination threat index is based on calculating the probability of contamination threat relying on the number of failed tests relative to the total number of tests conducted at the consumption point. The failed tests represent the samples with water quality parameters that exceeded the values measured at pumping into the network. Accordingly, the threat level increases as the number of failed samples increases. The benefit of this system is that the quality of supplied water is differentiated from the contamination that might occur at a later stage. Contamination threat index can later be specified to large or small areas. Hence, the focus will be directed toward the contamination potential instead of classifying the entire tap water that is supplied to the residents with a generalized assessment.
The results of implementing the concept of contamination threat index to Al-Baqa’a Refugee Camp are shown in Table 6. The results shown in Table 6 give more perspective into the status of Al-Baqa’a Refugee Camp’s tap water. According to the collected data and assessment using WA-WQI and CCME-WQI, the water quality at pumping was excellent; however, contamination incidents occurred. Since the study considered 10 household samples per round, Table 6 results were limited to the base 10 samples. The results show that the level of contamination threat varied over the study period from 10 to 40% with an overall contamination threat of 23.7%. Hence, the tap water at Albaqa’a Refugee Camp is under variable local contamination threat. This threat comes from limited-scale contamination in the network or the household storage tank. Efforts should be drawn to reduce the contamination threat to a minimum. Reducing these threats can be done by continuous maintenance, monitoring, and increasing residents’ awareness of storage tank preservation.

3.4 Study Limitations
The study faced several limitations that may affect the validity of the results. First, the study relied on samples collected from 10 households who were willing to cooperate with the study for 4 rounds. Consequently, obtaining more samples is expected to affect the results. Second, due to trespassing concerns and limited accessibility, the sampling was limited to faucets specified by the household’s residents. The study could not collect samples from all the household faucets. Third, due to time and logistics constraints, the study was limited to 4 rounds within 5 weeks. Therefore, the study could not study variation over a longer period. Future research should focus on measuring water parameters at different locations and over long periods. Finally, the study was limited to assessing the water quality in the camp without determining the exact cause of contamination incidents. Future research should focus on network contamination accidents, residents’ practices in maintaining their water storage tanks, and linking results to the contamination threat index.
4. CONCLUSIONS
The study explored the tap water quality in the Al-Baqa’a camp in Jordan. The study employed WA-WQI and CCME-WQI to understand the tap water quality status at Al-Baqa’a camp. The results illustrated that the physiochemical parameters of tap water and the water supplied to households are within the permissible range and standards. The results showed that the biological characteristics of the tap water are different from the characteristics of the water supplied. The results show that during the study period the water from the supply source (Al Baqa’a Reservoir No.20), reported the absence of both total coliform and Escherichia coli in the reservoir’s water, while the high levels found in some of the drawn tap water samples. The study concluded that the water supplied to the study area is safe and within drinking standards; however, the results indicate the occurrence of localized contamination. The contamination is expected to be within the vicinity of the household. Based on the WQI calculated using the Weighted Arithmetic method with all parameters considered the camp water is classified as “Unsuitable for Drinking”. The WQI calculated using the CCME method and including all water quality parameters indicated that camp tap water is “fair”. The threat description by the two indices showed that CCME-WQI is close to the real condition. The study showed that results obtained from WA-WQI and CCME-WQI are generalized and do not address the actual status of the tap water quality. The study suggested using a two-indice system to study tap water quality. The study suggested using WQI at the network pumping location and a contamination threat index. The two indices system differentiate between supplied water quality and localized contamination potential in the network or the household’s vicinity. Applying the two indices system at Al-Baqa’a Camp tap water showed that water supplied to the area is safe but it has a contamination potential of 23.7%. Future research should focus on expanding the methods for evaluating tap water quality and evaluating water parameters’ variation at different locations and over long periods.
ACKNOWLEDGMENT
This study was supported and funded by the Deanship of Scientific Research-University of Jordan.
DECLARATION AND STATEMENTS
•The authors declare no competing interests in publishing this work.
•All data that support the findings of this study are available from the corresponding author upon reasonable request
REFERENCES
Akter, T., Jhohura, F.T., Akter, F., Chowdhury, T.R., Mistry, S.K., Dey, D., Barua, M.K., Islam, M.A., and Rahman, M., 2016. Water Quality Index for measuring drinking water quality in rural Bangladesh: A cross sectional study. Journal of Health, Population, and Nutrition, 35 (1), Pp. 1–12.
Al-Amoush, H., Al-Ayyash, S., and Shdeifat A., 2018. Harvested Rainwater Quality of Different Roofing Material Types in Water Harvesting System at Al al-Bayt University/Jordan. Jordan Journal of Civil Engineering, 12 (2), Pp. 228-244.
Al-Farajat, M., and Salameh, E., 2010. Vulnerability of the Drinking Water Resources of the Nabataeans of Petra – Jordan. Jordan Journal of Civil Engineering, 4 (4), Pp. 321-335.
Al-Omran, A., Al-Barakah, F., Altuquq, A., Aly, A., and Nadeem, M., 2015. Drinking water quality assessment and water quality index of Riyadh, Saudi Arabia. Water Quality Research Journal of Canada, 50 (3), Pp. 287-296.
Bouhlel, Z., Köpke, J., Mina, M., and Smakhtin, V., 2023. Global Bottled Water Industry: A Review of Impacts and Trends United Nations, University Institute for Water, Environment and Health, Hamilton, Canada.
Brown, R.M., McClelland, N.I., Deininger, R.A., and Tozer, R.G., 1970. A Water Quality Index: Do We Dare? Water Sewage Works, 117 (10), Pp. 339–343.
Canadian Council of Ministers of the Environment (CCME). 2001. Canadian water quality guidelines for the protection of aquatic life: CCME Water Quality Index 1.0, User’s Manual. In: Canadian environmental quality guidelines, 1999, Canadian Council of Ministers of the Environment, Winnipeg.
Chen, S., Kimirei, I., Yu, C., Shen, Q., Gao, Q., 2022. Assessment of urban river water pollution with urbanization in East Africa. Environmental Science and Pollution Research 29 (27), Pp. 40812-40825. doi: 10.1007/s11356-021-18082-1.
Damo, R., and Icka, P., 2013. Evaluation of water quality index for drinking water. Polish Journal of Environmental Studies, 22 (4), Pp. 1045–1051.
Debbeler, L.J., Gamp, M., Blumenschein, M., Keim, D., Renner, B., 2018. Polarized but illusory beliefs about tap and bottled water: a product- and consumer-oriented survey and blind tasting experiment. Science of the Total Environment, 643, Pp. 1400-1410.
Doria, M., 2006. Bottled water versus tap water: understanding consumers’ preferences. Journal of Water and Health, 4 (2), Pp. 271-276.
Dutta, B., and Sarma, B., 2018. Assessment of Water Quality Index of the Kolong River of Nagaon District of Assam, India, 8 (6), Pp. 29–38.
Dwivedi, S., 2020. Evaluation of Drinking Water Quality Status By Water Quality Index: a Case Study of Shikhar Water Fall, Dehradun (Uk), India. International Journal Biological Innovations, 02 (02), Pp. 214–219.
El-Naqa, A., and Al Raei, A., 2021. Assessment of Drinking Water Quality Index (WQI) in the Greater Amman Area, Jordan. Jordan Journal of Earth and Environmental Sciences, 12 (4), Pp. 306-314.
Galal-Gorchev, H., 1993. WHO guidelines for drinking-water quality. Water Supply, 11 (3–4), Pp. 1–16.
García-Ávila, F., Zhindón-Arévalo, C., Valdiviezo-Gonzales, L., Cadme-Galabay, M., Gutiérrez-Ortega, H., and Flores del Pino, L., 2022. A comparative study of water quality using two quality indices and a risk index in a drinking water distribution network Environmental Technology Reviews, 11 (1), Pp. 49-61.
Geerts, R., Vandermoere F., Van Winckel T., Halet D., Joos P, Van Den Steen K., Van Meenen E., Blust R., Borregan-Ochando E, Vlaeminck S., 2020. Bottle or tap? Toward an integrated approach to water type consumption. Water Research, 173, Pp. 115-578.
Google Earth, 2021. Version 9.189.0.0. Albaqa’a Camp. 32o04’22” N 35o50’43” E Alt 658m. http://www.earth.google.com. [Last access Oct 10, 2022]
Hadadin, N., Qaqish, M., Akawwi, E., and Bdour, A., 2010. Water shortage in Jordan – Sustainable solutions. Desalination, 250 (1), Pp. 197–202.
Horowitz, N., Frago, J., and Mu, D., 2018. Life cycle assessment of bottled water: a case study of Green2O products. Waste Management, 76, Pp. 734-743.
Ibrahim, M., 2018. Evaluation of Groundwater Quality Suitability for Drinking Purpose Using Water Quality Index Approach in Yarmouk Basin, Jordan. Jordanian Journal of Engineering and Chemical Industries, 1 (2), Pp. 84–92.
Ibrahim, M., 2019. Assessing groundwater quality for drinking purpose in Jordan: Application of water quality index. Journal of Ecological Engineering, 20 (3), Pp. 101–111.
Jordan Standards (JS), 2015. Jordanian Standard 286/2015 on Water/Drinking Water.
Kachroud, M., Trolard, F., Kefi, M., Jebari, S., and Bourrié, G., 2019. Water quality indices: Challenges and application limits in the literature. Water (Switzerland), 11 (2), Pp. 1–26.
Karim, M.A., Uddin, M.H., Barua, S., Nath, B., Chowdhury, A.I., Hoque, M.A., and Rahman, I.M.M., 2019. Pollution Source Identification of Halda River Water Using Field Observation, Laboratory Analysis, and GIS Technique. Oriental Journal of Chemistry, 35 (5), Pp. 1480–1490.
Kumar, A., and Dua, A., 2010. Water quality index for assessment of water quality of river Ravi at Madhopur (India). Global Journal of Environmental Sciences, 8 (1), Pp. 49–57.
Nortcliff, S., Carr, G., Potter, R., and Darmame, K., 2008. Jordan’s water resources: challenges for the future. Geographical Paper, 185, Pp. 1-24.
Pei-yue, L.I., Hui, Q., and Jian-hua, W.U., 2010. Groundwater Quality Assessment Based on Improved Water Quality Index in Pengyang County, Ningxia, Northwest China. Journal of Chemistry, 7, Pp. 209–217.
Properzi, F., 2010. Rapid assessment of drinking-water quality in the Hashemite Kingdom of Jordan: country report of the pilot project implementation in 2004-2005. World Health Organization: Geneva, Switzerland.
Ravikumar, P., Aneesul Mehmood, M., and Somashekar, R.K., 2013. Water quality index to determine the surface water quality of Sankey tank and Mallathahalli lake, Bangalore urban district, Karnataka, India. Applied Water Science, 3 (1), Pp. 247–261.
Sharma, D., and Choudhary, S.K., 2014. Evaluation of Water Quality Index for Assessment of Water Quality of the Budhi Gandak River At Khagaria, Bihar. Pollution Research, 33 (4), Pp. 715–720.
Shotyk, W., and Krachler, M., 2007. Contamination of Bottled Waters with Antimony Leaching from Polyethylene Terephthalate (PET) Increases upon Storage. Environmental Science & Technology, 41 (5), Pp. 1560–1563.
Sutadian, A., Mutil, N., Yilmaz, A., and Perera B., 2016. Development of River Water Quality Indices – A Review. Environmental Monitoring and Assessment, 188, Pp. 274–282.
Toma, J., Ahmed, R., and Abdulla Z., 2013. Application of Water Quality Index for Assessment Water Quality in Some Bottled Water Erbil City, Kurdistan Region, Iraq. Journal of Advanced Laboratory Research in Biology, 4 (4), Pp. 128-134.
Tri-Star Environmental Consulting, 2012. Synthesis of research and application of the CCME water quality index. March 2012. Pp. 54.
UNRWA, 2023. Baqa’a Camp Profile. UNRWA Report. Website: https://www.unrwa.org/sites/default/files/baqaa_camp_profile_final_-_april_2023.pdf Last accessed: September 12th, 2023.
Yadav, A.K., Khan, P., and Sharma, S.K., 2010. Water quality index assessment of groundwater in Todaraisingh tehsil of Rajasthan State, India-A greener approach. E-Journal of Chemistry, 7(SUPPL. 1), Pp. 428–433.
| Pages | 79-86 |
| Year | 2024 |
| Issue | 1 |
| Volume | 8 |
