FLOOD HAZARD MAPPING OF USK RIVER LOCATED IN WALES, UNITED KINGDOM THROUGH PERFORMING THE HYDROLOGICAL ANALYSIS OF THE DIGITAL ELEVATION MODEL AND LANDSAT 8-OLI USING GIS AND REMOTE SENSING TECHNIQUES
Journal: Water Conservation and Management (WCM)
Author: Hayder H. Kareem, Uday Abdulsahib Alturfi, Nabaa Noori Bashboosh
Print ISSN : 2523-5664
Online ISSN : 2523-5672
This is an open access article distributed under the Creative Commons Attribution License CC BY 4.0, which permits unrestricted use, distribution, and reproduction in any medium, provided the original work is properly cited
Doi: 10.26480/wcm.01.2024.87.96
Abstract
 Recently, identifying the key factors contributing to the occurrence of floods has become a significant focal point. Remote Sensing (RS) and Geographical Information System (GIS) have emerged as powerful tools for spatially predicting Flood Risk/Hazard Mapping (FRM/FHM). Usk River in Wales, United Kingdom, is an extension of the flood map was developed by identifying and utilizing six parameters known to influence flood events. These parameters: elevation, slope, river distance, land cover, flow length, and precipitation were carefully derived through the application of RS and GIS techniques on the Digital Elevation Model and Landsat 8-OLI imagery of Usk River. Thematic maps were generated for each parameter, then categorized into five levels ranging from very low to very high, and finally reclassified to result in FRM/FHM for the Usk River. The outcomes revealed that regions situated in the upper northern reaches of the Usk River (adjacent to its inlet), as well as areas in the far eastern and western sectors of the central catchment, are particularly susceptible to high flood risks. This is noteworthy even in areas with elevated ground levels. Conversely, the central and southern portions of the Usk River catchment (near the outlet) are projected to be at lower risk of flooding. The insights and conclusions derived from this study can serve as valuable resources for planners, aiding them in devising effective strategies to diminish the vulnerability associated with flood hazards. This, in turn, contributes to enhanced flood risk mitigation and prevention within the studied region.
Keywords
Flood Risk/Hazard Mapping (FRM/FHM), GIS, Remote Sensing, Usk River, United Kingdom.
1. INTRODUCTION
Floods, among the most prevalent natural disasters worldwide, possess significant potential for causing extensive devastation (Stefanidis and Stathis, 2013). Over recent decades, the occurrence of numerous flood events has left indelible marks on global economies, essential resources, and the well-being of humanity, rendering their impacts irreversible. Consequently, Flood Risk Mapping (FRM) emerges as a paramount undertaking in evaluating the potential risks associated with floods, with the ultimate goal of mitigating their destructive consequences in regions susceptible to flooding. Given the multitude of influential parameters implicated in flood occurrence, the utilization of contemporary and precise data assumes paramount importance in ensuring the quality of decision-making processes. Flood risk mapping’s primary goal is to effectively handle floods caused by rainfall and subsequent overflow, with the ultimate aim of reducing casualties and property loss.
Topographic characteristics, Land Use (LU) patterns, river systems, and the presence of dams are only some of the unfavorable environmental and geographical elements that work together with heavy rains to bring about flooding in certain areas. Quantitative and semi-quantitative approaches to assessing flood risk account for the interplay between topography, soil type, rainfall patterns, land use, and many hydrological features of watersheds (Hallegatte et al., 2013). Accurate field data containing the environmental features that occurring within floodplains are required to estimate flood occurrences. This, however, is a time-consuming and energy-consuming operation. Numerous numerical models have been developed to solve the equations, such as the Saint-Venant formula, that control flood dynamics in 1-D, 2-D, and 3-D settings (Papaioannou et al., 2016; Afshari et al., 2018; Costabile and Costanzo, 2021). Both Finite Difference Methods (FDMs) and Finite Element Methods (FEMs) rely on a wide range of inputs to achieve their desired levels of accuracy through the precise investigation of the hydrodynamic conditions during flooding events (Petroselli et al., 2019; Costabile et al., 2021; Liu et al., 2021; Woodruff et al., 2021). The success of FEMs and FDMs is also heavily impacted by the accuracy of the chosen numerical methods (explicit or implicit) and grid sizes.
As a recurrent natural disaster, flooding has caused extensive damage to homes, displaced countless people, and ruined agricultural areas in the area. They are the most common and severe natural disasters, with far-reaching effects on economies and societies everywhere they occur. Since 2006, the number of hydrological catastrophes has annually outnumbered the number of meteorological disasters. The majority of natural disasters in 2016 were caused by water, accounting for 51.8%, more than the 2006-2015 average of 50.5%. Geographical disasters accounted for 11.1% of all disasters, whereas meteorological disasters accounted for 28.1%, compared to an annual average of 32.4% (Guha-Sapir et al., 2016). According to the International Strategy for Disaster Reduction, flooding is considered as a common and widespread natural catastrophes throughout nearly all regions of the world (ISDR, 2023). Other common potential hazards include earthquakes, volcanoes, landslides, tsunamis, and hurricanes. As a result, over 520 million people worldwide are affected by floods annually, resulting in an estimated 25,000 deaths, massive population displacement, disease epidemics, agricultural and livestock losses, and major structural damage. Many low-income earners build their homes in low-lying locations because of their limited access to urban land and meager salaries. When floods come, however, they have a devastating effect on more than just the people who live in rural areas. Recent extreme weather has caused rivers to swell dramatically, leading to the breaking of their banks and the flooding of nearby “flat” fields and floodplains.
The precision with which floods can be simulated depends on a wide variety of elements. Methods of comparison relying on various mathematical methodologies which are limited in their relevance to certain flood scales. Hence, there is a pressing want for a dependable tool that exhibits less susceptibility to these factors. Remote Sensing (RS) has been a popular option because it can quickly and cheaply collect data without humans (Zhao et al., 2019; Dodangeh et al., 2020). The combination of Remote Sensing and Geographic Information System (GIS) methods has made Flood Hazard Maps (FHMs) more complex (Bhat et al., 2013; Bhat and Rao, 2016; Saha and Praneeth, 2016; Sharma and Rao, 2016). Most of the researcher’s have highlighted the use of these maps to identify and classify flood-damaged regions (Elkhrachy, 2015; Gitika and Ranjan, 2016; Farish et al., 2017; Sadeghi-Pouya researchers, 2017).
Bourenane and colleagues employed hydrogeomorphological interpretation and analytical approaches to assess urban flood risk management strategies (Bourenane and colleagues, 2019). Meanwhile, Youssef and Hegab appraised Egyptian flood risk models utilizing ArcGIS and the Analytic Hierarchy Process (AHP) (Youssef and Hegab, 2019). Multiple local criteria were employed to correctly map flood damage in this investigation. A group researcher examined flood risk mapping using GIS-integrated MCDM (Ogato et al., 2020). This time, they evaluated Land Use, Elevation, Slope, Precipitation, Drainage Density, and Soil Type. Some researchers used LiDAR and hydrometric models to map flood risk. The investigation produced numerous promising models (Guerriero et al., 2020). A group researcher used ML to map metropolitan flood risk (Eini et al., 2020). They enhanced flood risk assessment by including economic, social, and infrastructure elements.
Flood risk management requires identifying vulnerable areas. This helps deliver timely notifications, prompt responses, and minimize future flood disasters. Combining information with hydro-environmental indicators including topography, soil composition, precipitation patterns, water body density, vegetation state, and land use is difficult when utilizing Geographic Information System (GIS) software to estimate hazards. It requires a lot of processing time, which hinders flood observation. Integrating many flood indices (including biological and hydro-environmental factors) and determining their interrelationships is a challenging aspect of flood risk mapping (Rimba et al., 2017).
Land Cover (LC), Elevation represented by (DEM) (EI), Slope (S), Precipitation (P), River Distance (RD), and Flow Length (FL) are six physical indicators that must be thoroughly analyzed within the ArcGIS framework in order to do spatial analysis and carry out flood risk mapping. High-risk locations can only be found in the investigation’s latter stages, thus it’s crucial that it be thorough. Flood risk zones must be regularly monitored and mapped using a RS approach. The purpose of this research is to create a map of the flood risk zones (Flood Risk/Hazard Map) along the Usk River’s basin. A flood hazard map can be used to great advantage to identify vulnerable areas to flooding. This is the first study of its kind, therefore the resulting map will be invaluable in helping authorities and planners deal with the threat. In order to achieve the goals of this study, we employ the most up-to-date satellite imagery from the Landsat 8OLI satellite and the Digital Elevation Model (DEM) from the Shuttle Radar Topography Mission (SRTM) to establish an FHM for the Usk River for the first time.
2. RESEARCH AREA OF STUDY
The region of interest considered in this research is Usk River catchment/basin. The region encompassed by the Usk River area spans from the elevated terrain of the Brecon Beacons in the northern part to the flat farmland in the southern region. It is primarily characterized by its rural nature and comprises the River Usk and its various tributaries. Noteworthy among these are the Sor Brook and Malpas Brook, both of which drain directly into the Usk Estuary. Additionally, the area encompasses the coastal lowlands known as the Caldicot levels. This catchment holds significant value in terms of ecology, agriculture, and recreational opportunities. Geologically, the catchment area is situated upon a foundation of solid rocks with ages ranging from the Silurian to the early Jurassic period, approximately spanning 420 to 200 million years ago. These rock formations are occasionally covered by a thin layer of loose Quaternary deposits, originating from the last Ice Age, as well as sediments carried by the modern river system, dating back around 122,000 to the present. The primary aquifers in the Usk River area consist of the Old Red Sandstone (ORS), Carboniferous Limestone, and loose materials found along the river valleys. While groundwater contributions to the river flow are limited, they mainly arise from the Old Red Sandstone, the Coal Measures, or from sandy and gravelly deposits within the river channels (Natural Resources Wales, 2017).
The primary source of water abstraction that exerts the most notable pressure within the River Usk catchment is directed towards public water supply. This purpose accounts for roughly 94%1 of the total annual abstraction within the catchment area. This catchment zone holds immense strategic significance in furnishing safe drinking water to a substantial portion of South East Wales. To facilitate the distribution of this water throughout the region, an elaborate network of water transfers has been established. The River Usk and its tributaries are key wildlife corridors. These sites are important migratory corridors and breeding grounds for various national and worldwide species. The river ranges from a little lowland river with few nutrients to a massive highland river with a large tidal effect. The interaction between geology, soil types, adjoining land use, and hydrology makes this environment biologically rich. Waters with moderate nitrogen levels support aquatic plant communities in most of the smaller rivers that feed into the River Usk. Alongside these tributaries, substantial stretches of semi-natural riparian habitats remain, encompassing various types such as semi-natural woodlands, dry and wet grasslands, expanses of tall fen and marsh vegetation, as well as gravel banks. Despite facing pressures from development activities leading to a loss of wetland habitat, the catchment still boasts notable pockets of wetland habitat and the associated species. These wet habitats extend beyond the river and its tributaries and encompass features like lakes, reservoirs, fens, reed beds, ponds, rhos pastures, blanket and raised bogs, wet woodlands, and wet heaths (Natural Resources Wales, 2016).
The River Usk extends for approximately 121 kilometers, with the catchment covering an area of around 1,169 square kilometers. The prevailing climate is characterized by its mild nature and ample precipitation, with an average annual rainfall of 1,700 millimeters in the upland regions and 1,100 millimeters in the lowlands. By comparison, the entirety of Wales experiences an average annual rainfall of 1,310 millimeters. In the upper segment of the Usk catchment, there is a marked tendency toward a rapid and unpredictable flow pattern, a consequence of swift runoff resulting from the steep-sided, narrow valleys and shallow soils underlain predominantly by impermeable rock. Consequently, during periods of intense rainfall, the floodplains in the lower stretches of the river often become submerged. On the other hand, the lower Usk displays less sensitivity to rainfall events due to its broader catchment area and the gentle topography of the lowlands. This portion of the river stands as a unique example of a large lowland river that has remained relatively untouched by significant human alterations or modifications (Designated Special Area of Conservation, 2023). Figures 1 and 2 demonstrate the map of Usk River area and a sketch showing the ground surface elevations in a 3-Dimensional view, respectively.
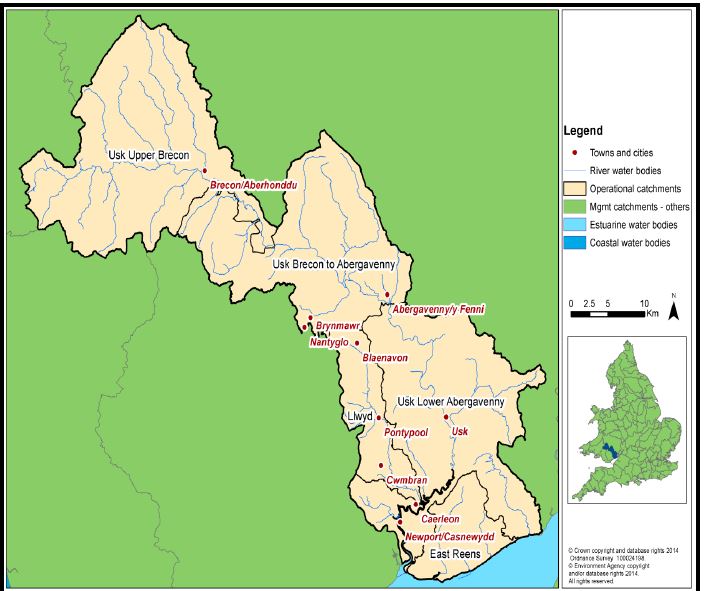
Figure 1: Usk River catchment area
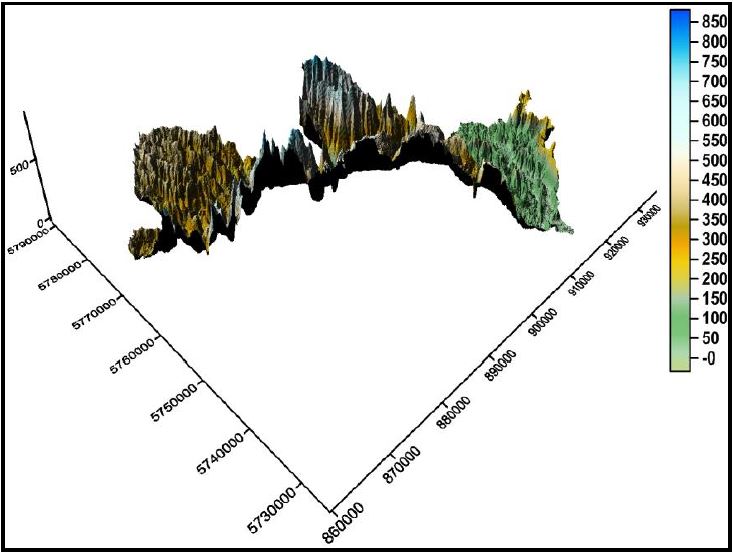
Figure 2: Ground surface elevations in 3-Dimensional view/p>
3. METHODOLOGY
The current research used the Landsat 8-OLI satellite picture and the DEM from the SRTM to create the Flood Hazard Map (FHM) for the Usk River Basin. The United States’ National Aeronautics and Space Administration (NASA) and National Geospatial-Intelligence Agency (NGA) are spearheading an international effort to create a digital elevation model (DEM) using data from the Shuttle Radar Topography Mission (SRTM). An heavily modified radar sensor was flown on Space Shuttle Endeavour’s STS-99 mission as part of the SRTM programme. The vertical precision of this SRTM DEM data is 16 meters, and its spatial resolution is 30 meters. The SRTM DEM data utilized in this analysis is current as of September 23, 2014 (the little image). In addition, you can easily view and download this information from the USGS website at https://earthexplorer.usgs.gov/.
Launched in February 2013, the Landsat 8-OLI optical satellite is among those that have been put to good use in the field of environmental science. The OLI sensor aboard the Landsat 8 satellite was used for this investigation. The spatial resolution of this sensor spans from 15 to 30 meters in the panchromatic, visible, and near-infrared ranges, and from 100 meters in the thermal bands. Bands with a spatial resolution of 30 meters or more were used for this study. It’s worth noting that this satellite data has global coverage and has been used for analysis by means of Geographic Information Systems (GIS).
It can be obtained from the USGS website and downloaded for nothing. Since cloud cover could provide a problem when processing Landsat 8 Optical data, clearer images were favored for this analysis. This research relied on Landsat 8-OLI images that were downloaded on June 2, 2023. Since flood risk maps are based on risk characteristics, the accuracy of the resulting map is heavily dependent on the precision and quality of the data used to generate these parameters. Indeed, more detailed information means more accurate maps. In this analysis, we focused on pictures with low cloud cover across time (less than 5%). Landsat 8-OLI and DEM data were resampled to a 30 m spatial resolution to guarantee consistency in pixel size across all products. The standards for gauging flood danger were re-categorized as a result.
Considering that handling qualitative and nonlinear data poses a substantial challenge in FRM, the initial phase of FRM involves the careful selection of the most crucial parameters that influence areas prone to flooding. However, it’s essential to note that not all flood-prone regions exhibit identical characteristics, leading to potential variations in these parameters across different areas. In this particular study, a total of 6 environmental parameters (DEM, Land Cover, River Distance or Euclidean Distance, Precipitation, Slope, and Flow Length) were employed to account for flood occurrence in Usk River Basin’s study area.
4. ENVIRONMENTAL PARAMETERS PROCESSING RESULTS
Flood risk information is essential for enhancing our comprehension and insight to formulate efficient strategies for mitigating floods. The identification of flood-prone regions holds paramount importance for policymakers, enabling the development of effective plans and management measures. The utilization of flood hazard mapping can significantly aid in pinpointing areas most susceptible to flooding and proactively engaging in preventive measures. The application of Geographic Information System (GIS) based multi-criteria evaluation methods has found extensive use in mapping flood hazards and risks. This approach amalgamates spatial data with user preferences to establish priority rankings for decision-makers.
4.1 Usk River DEM Extraction
The DEM illustrates the changes in point elevations across the Usk River area within each pixel, measured in meters. DEM model was sourced from the USGS EarthExplorer Website, offering a spatial resolution of 30 meters. In relation to FR, higher ground reduces vulnerability, hence higher sites are safer than lower ones.. To exemplify, a point located at the summit of a mountain faces lower risk compared to points on a hillside. Areas with lower altitude are more vulnerable to the risks associated with flooding. Within the Usk River area, the southern and southeastern regions exhibit lower elevations, indicating a heightened probability of flooding in these areas. Water naturally flows from higher to lower elevations, resulting in the accumulation of water in the lower elevation zones. The elevation range across the research area varies from 879 to -32 meters, as depicted in Fig. 3. Elevated areas are predominantly concentrated in the Middle Eastern and western sections of the study region.
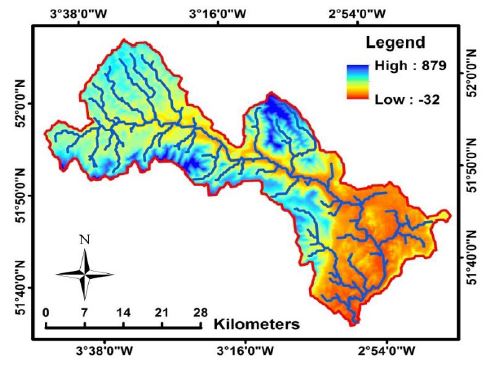
Figure 3: The Digital Elevation Model (DEM) of Usk River catchment
4.2 Land Cover (LC) of Usk River catchment
Land use type stands out as a significant factor influencing flood dynamics. A group researchers established a strong correlation between flood-prone regions and alterations in land use, particularly in locales where urbanization has led to increased moisture insulation (Apollonio et al., 2016). Flood incidents manifest differently across areas with distinct characteristics. For example, flooding mechanisms substantially differ in urban zones, vegetated areas, and regions characterized by specific soil and rock compositions. Consequently, each feature assumes a pivotal role in the process of FRM.
The U.S. Geological Survey (USGS) has furnished a comprehensive Land Cover Database for global regions. This repository, known as the National Land Cover Database (NLCD), constitutes a definitive 30-meter resolution Landsat-based compilation of land cover information worldwide. The NLCD supplies spatial references and descriptive data encompassing land surface attributes, such as thematic classes (e.g., urban, agricultural, and forested), percentage of impervious surfaces, and tree canopy cover percentages. The NLCD caters to a diverse range of applications by governmental and non-governmental bodies at various levels seeking to evaluate ecosystem health, comprehend biodiversity spatial patterns, predict climate change impacts, and formulate land management strategies. The Multi-Resolution Land Characteristics (MRLC) Consortium, led by the U.S. Geological Survey, collaborates among federal agencies to generate NLCD products. These resources are available for public download free of charge through the MRLC website: https://www.mrlc.gov/.
In the current study, distinct land use features were delineated within the study area, including water bodies, urban zones, barren areas, cropland, agricultural land, shrubbery, forested regions, and herbaceous spaces. Subsequently, depending upon the Landsat 8-OLI image analysis that having a spatial resolution of 30 m, five distinct classes were assigned to these land use features, as illustrated in Figure 4.
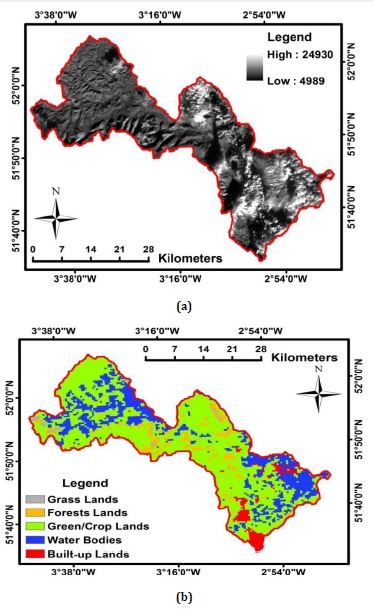
Figure 4: a) Extracted Landsat 8-OLI of Usk River catchment, and b) LC of Usk River catchment
4.3 River Distance (RD)
The measurement of the distance from a river holds substantial importance when mapping flood risks, as regions situated near rivers are consistently vulnerable to the potential destructive impacts of flooding. River distance stands out as a critical factor with significant applicability in FRM. The river network is derived from the DEM data. Initially, river pixels are assigned a value of zero, with this value subsequently increasing as the distance from the river expands. To extract RD, It needs to process the DEM with various steps to finally reaching the RD. Whereas, it requires to get, Fill, Flow Direction, Flow Accumulation, Stream Order, CON-Stream Order, Stream to Feature, and then will produce the RD as depicted in Figure 5. The River Distance (RD) parameter spans a range from 0 to 0.34 within the study area, exemplified by the Usk River.
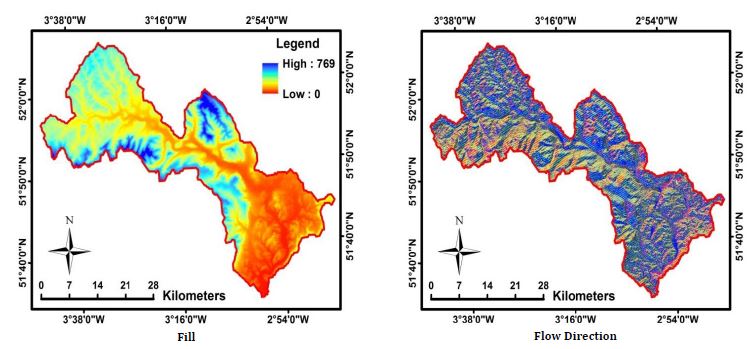
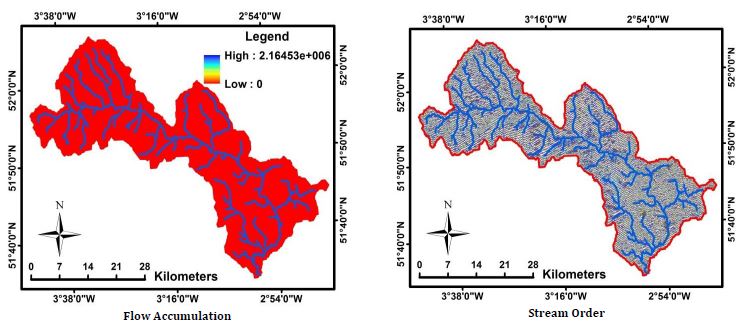
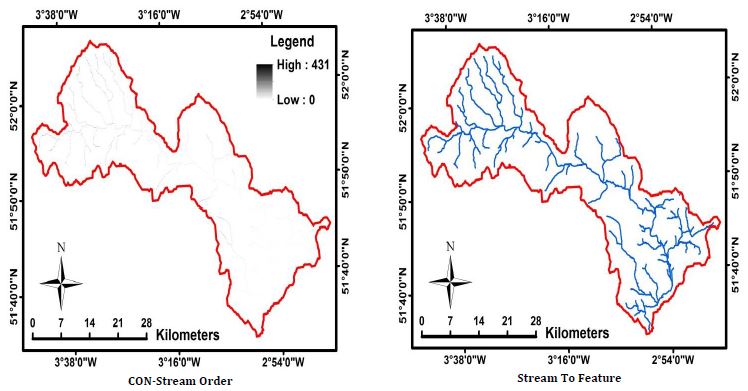
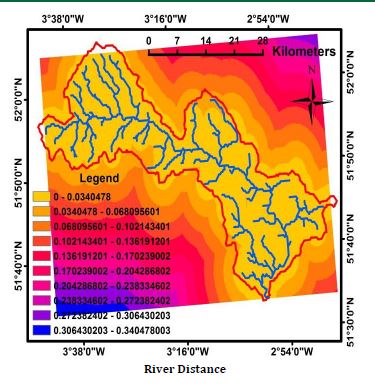
Figure 5: Extracted River Distance (RD) of Usk River catchment
4.4 Precipitation of Usk River catchment
The discharge of a river is greatly affected by the distribution of precipitation across its entire area. Using the Kriging method within a Geographic Information System (GIS), an interpolated rainfall map was created for the research area. The quantity of rainfall directly impacts the likelihood of flooding. Importantly, the cumulative rainfall amount within a specific timeframe has a more significant influence than the intensity of individual rainfall events. To compile the overall rainfall data, precipitation information for the study region was obtained from the Climatic Research Unit (CRU).
The Natural Environment Research Council (NERC) of the United Kingdom and the United States Department of Energy provided initial funding for the creation, enhancement, and maintenance of the CRU TS dataset. Right now, the UK’s National Centre for Atmospheric Science (NCAS), a NERC-affiliated joint institution, is providing long-term support. The CRU comprises a team of around thirty researchers and students who have played a pivotal role in shaping various widely used climate research datasets. Among these datasets is a global record encompassing temperature, precipitation, near-surface temperature, near-surface temperature maximum, cloud cover, and more, which are utilized for monitoring climate system conditions. Furthermore, the CRU has contributed to the development of statistical software packages and climate models. The CRU TS dataset provides data that is computed on finely gridded high-resolution (0.5×0.5 degree) grids.
The interpolated map derived from the CRU TS dataset reveals that the average monthly precipitation across the research area spans between 800 and 1418 mm as explained in Figure 6. Precipitation values exhibit an increase from the southeastern region toward the northwest part of the study area. The lowest precipitation intensity was monitored in the far southeastern corner of the Usk River Basin, while the highest concentration was recorded in the northern segment of the Usk River Basin.
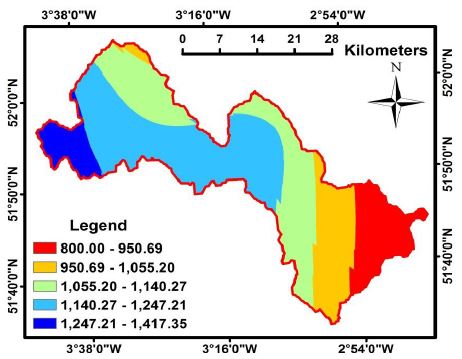
Figure 6: Extracted the monthly precipitation of Usk River catchment
4.5 Slope of Usk RiverThe inclination of the terrain plays a significant role in governing various aspects of surface water runoff, exerting significant influence over factors such as flow speed, flow direction, and the formation of valley streams. These factors collectively determine the flow velocity and the time it takes for water to travel to the basin’s outlet. The slope’s impact on the hydrological characteristics of the basin is determined by two key attributes: the steepness of the slope and its orientation within the basin.
The Usk River basin in Wales exhibits a maximum slope of 65 degrees, located both to the north and south within the basin’s midsection, along with several scattered elevations dispersed across the riverbed. The degrees of slope regression fall into five distinct categories. The slope categories 0-5 and 5-10 degrees is predominantly present in the uppermost source region of the river and the lower estuarine region. The 10-16 degree slope category is densely concentrated in the middle
segment of the river basin and in other parts of Usk River. The categories of 16-25 degrees and 25-65 degrees are largely contiguous and situated along the peripheries of the Usk River and its tributaries. Figure 7 shows the pattern of Slope over the entire area of Usk River Basin.
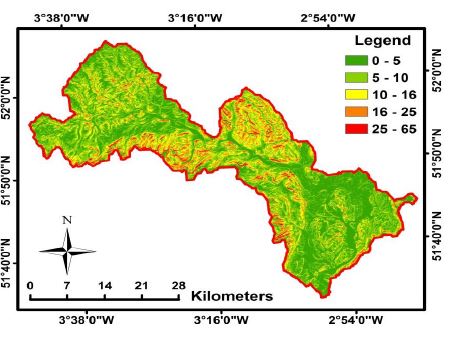
Figure 7: Slope of Usk River catchment
4.6 Flow Length of Usk River
The concept of “flow length” in the context of rivers refers to the distance that water travels within a river network from its point of origin, typically its source or headwaters, to a specific downstream location, often the river’s outlet or mouth. This distance encompasses the intricate path that water takes as it courses through various channels, tributaries, and meanders of the river system. The flow length of a river plays a crucial role in understanding its hydrological dynamics, ecological processes, sediment transport, and the interaction between the river and its surrounding landscape. Figure 8 illustrates that the regions situated to the northwest of the Usk River will necessitate longer distances for high flow to reach their ultimate destination. In contrast, the areas located in the central and southwestern parts will require shorter flow distances to reach either the main course of the river or the final outlet.
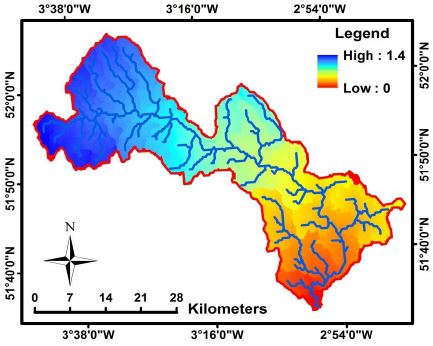
Figure 8: Flow Length of Usk River catchment
4.7 Reclassifying Parameters of Usk River
To achieve a highly accurate flood map for the Usk River, capable of providing reliable predictions for potential flood-prone areas in the future, it is essential to categorize the parameters obtained during the hydrological analysis within a Geographic Information System (GIS) program. One of the most important steps in the process of developing the flood risk map is the classification of parameters, which includes the DEM, LC, River Distance or Euclidean Distance, Precipitation, Slope, and Flow Length. The hydrological analysis, as the initial phase of the flood risk map extraction process, serves to identify the spectrum of values experienced by the analyzed variables. It unveils critical insights into the river’s hydrological behavior, its interaction with the surrounding terrain, and its exposure to diverse geographical, environmental, and climatic attributes along the course of the Usk River.
In the present phase, the numerical outcomes generated through the hydrological analysis undergo a transformation into informative values that indicate regions susceptible to varying environmental and climatic hazards, precisely represented on the map in relation to each of the corresponding parameter. For each region, the effects of each parameter are ranked from least severe (very low) to most severe (very high). The categorization approach examines Usk River valley forces in detail.
GIS’s “Reclassify” function in the “Reclass” subsection of the “Spatial Analyst Tools” menu category. This thorough process ensures that the flood risk assessment properly represents Usk River basin vulnerabilities, which helps make educated choices and execute appropriate mitigation techniques. Figure 9 depicts the hydrological parameters that were evaluated, along with the categories that represent each parameter.
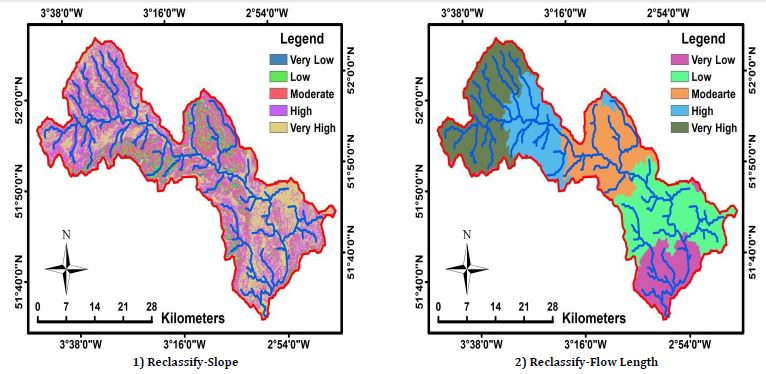
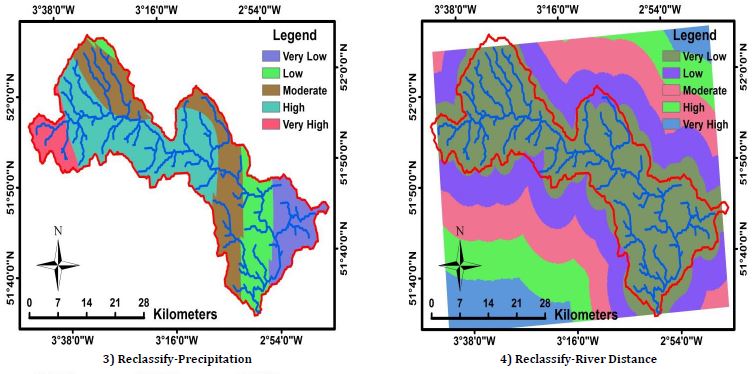
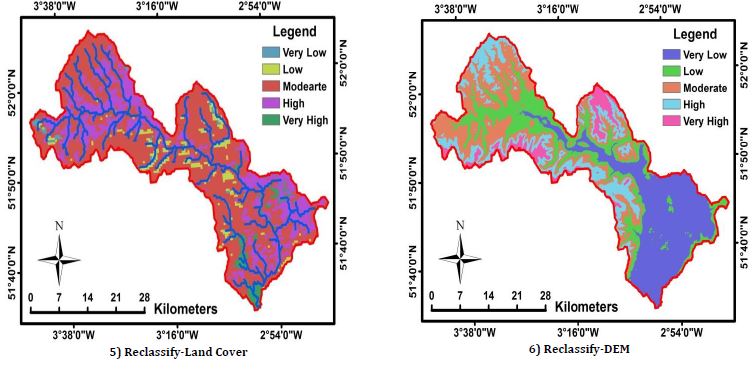
Figure 9: Reclassifying the assigned parameters of Usk River catchment
5. FHM/FRM RESULTS AND DISCUSSION
Flooding has effects beyond land damage. Floods may damage ecosystems, economies, and populations. Floods may harm the economy, ecology, and infrastructure. Understanding the complexity of flood damage is necessary to build effective flood mitigation methods. This study examines floods’ complex effects. It shows the different ways floods appear and the need of adopting preventative actions to increase flood resilience. Modern disaster management and urban planning emphasize flood danger mapping. Flood-prone areas are assessed, studied, and portrayed in this process. Flood risk maps include geography, hydrology, climatic changes, and previous flood data to assess risk. These maps highlight high-risk flood zones and categorize risk.
In this conclusive stage, the hydrological parameters that have undergone classification, as depicted in Fig. 9, are amalgamated to yield the ultimate flood map. This map delineates regions potentially susceptible to flooding in the vicinity of the Usk River. The parameter integration process follows the sequence outlined in Fig. 9 (from 1 to 6). To extract the Flood Risk/Hazard Map (FHM/FRM), the GIS program employs the “Weighted Sum” command from the “Overlay” submenu within the “Spatial Analyst Tools” main menu.
Figure 10 illustrates a FHM/FRM for the Usk River in Wales. Analyzing the map reveals notable trends: regions positioned to the northwest of the Usk River (constituting the river’s origin/inlet) are at a heightened risk of flooding. This heightened risk arises from potential future precipitation amounts or a confluence of hydrological and climatic factors along the Usk River’s catchment. Additionally, areas situated at the midpoints of the Usk River, both to the far east and west, also face exposure to flood risks. Conversely, regions located in proximity to the riverbed’s centerline and those in the southern section of the Usk River, nearer to its mouth/outlet, appear less susceptible to flooding hazards due to their distance from the river’s inlet.
Taking a larger perspective, it is very necessary to perform proactive and accurate monitoring of the water levels in the Usk River as well as the predicted surges. The purpose of this monitoring is to enable drainage solutions that are both optimum and quick in order to prevent the possible dangers that are connected with floods. The process of highlighting efficient management measures for flood risks is considered one of the priorities that receive the greatest importance, since these preventive measures will ultimately lead to reducing the potential risks of flood and mitigating the consequences, which are often widespread in their impact on land areas.
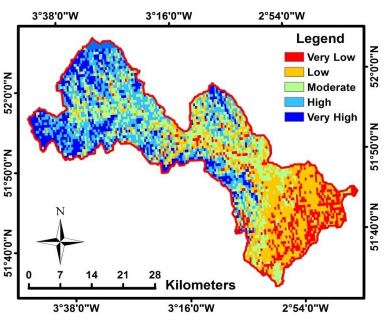
Figure 10: Flood Hazard/Risk Map (FHM/FRM) of Usk River catchment
6. CONCLUSIONS
The increasing possibilities that occur as a result of the severity of extreme weather events, such as floods, must be taken into account, as there is an increasing risk that will lead to the deterioration of infrastructure and subsequent economic losses resulting from the submergence of land areas with water resulting from the flood phenomenon. That being the case, the design of a method to assess the socio-economic losses that are concomitant becomes of the utmost importance. This attempt is supported by a comprehensive and rigorous process that is characterized by complicated, nonlinear, and multi-dimensional data. Although flood risk mapping is helpful for predicting and dissecting geographical weaknesses, it is important to note that this endeavor is backed by a multifaceted and systematic approach. The intricacy of the data makes it necessary to have powerful computer hardware and a significant amount of time to spend on computations while dealing with it. Recognizing the parameters influencing floods and generating a risk map stands as a fundamental approach to manage this natural calamity. Various researchers have proposed several methodologies to gauge the extent of flood risk and its severity.
The current investigation emerged as a result of employing RS and GIS techniques. This study aimed to evaluate the potential for flooding and generate a risk map within the Usk River catchment in Wales, utilizing GIS software. Six factors were utilized for creating maps related to flood susceptibility and risk: DEM, LC, Euclidean Distance from the river, Precipitation, Slope, and Flow Length. These factors underwent reclassification and were assigned weighted values through expert assessment to ultimately produce the flood hazard and risk maps within the GIS framework. The area under scrutiny is prone to flooding due to the combined influence of these analyzed variables. Specifically, the upper north-west, far middle east, and western regions of the Usk River catchment face elevated flood risks. Conversely, the remaining areas surrounding the Usk River are either minimally affected or relatively secure against the threat of flooding.
REFERENCES
Afshari, S., Tavakoly, A.A., Rajib, M.A., Zheng, X., Follum, M.L., Omranian, E., Fekete, B.M., 2018. Comparison of new generation low-complexity flood inundation mapping tools with a hydrodynamic model. J. Hydrol., 556, Pp. 539–556. DOI: 10.1016/j.jhydrol.2017.11.036.
Apollonio, C., Balacco, G., Novelli, A., Tarantino, E., Piccinni, A.F., 2016. Land Use Change Impact on Flooding Areas: The Case Study of Cervaro Basin (Italy). Sustainability, 8 (996), Pp. 1-18. DOI: 10.3390/su8100996.
Bhatt, C.M., Rao, G.S., 2016. Ganga floods of 2010 in Uttar Pradesh, North India: A perspective analysis using satellite remote sensing data. Geomat Nat Haz Risk, 7, Pp. 747–763. DOI: 10.1080/19475705.2014.949877.
Bhatt, C.M., Rao, G.S., Begum, A., Manjusree, P., Sharma, S.V.S.P., Prasanna, L., Bhanumurthy, V., 2013. Satellite images for extraction of flood disaster footprints and assessing the disaster impact: Brahmaputra floods of June-July 2012, Assam, India. Curr Sci., 104, Pp. 1693–1700.
Bourenane, H., Bouhadad, Y., Guettouche, M.S., 2019. Flood hazard mapping in urban area using the hydrogeomorphological approach: Case study of the Boumerzoug and Rhumel alluvial plains (Constantine city, NE Algeria). J. Afr. Earth Sci., 160, Pp. 103602.
Costabile, P., Costanzo, C., 2021. A 2D-SWEs framework for efficient catchment-scale simulations: Hydrodynamic scaling properties of river networks and implications for non-uniform grids generation. J. Hydrol., 599, Pp. 126306. DOI: 10.1016/j.jhydrol.2021.126306.
Costabile, P., Costanzo, C., Lorenzo, G.D., Santis, R.D., Penna, N., Macchione, F., 2021. Terrestrial and airborne laser scanning and 2-D modelling for 3-D flood hazard maps in urban areas: New opportunities and perspectives. Environ. Model. Softw., 135, Pp. 104889. DOI: 10.1016/j.envsoft.2020.104889.
Designated Special Area of Conservation, 2023. River Usk/Afon Wysg [Internet]. [updated 2023 August 15; cited 2023 August 15]. Available from: https://sac.jncc.gov.uk/site/UK0013007 (Accessed August 15, 2023).
Dodangeh, E., Choubin, B., Eigdir, A.N., Nabipour, N., Panahi, M., Shamshirband, S., Mosavi A., 2020. Integrated machine learning methods with resampling algorithms for flood susceptibility prediction. Sci. Total Environ., 705, Pp. 135983. DOI:10.1016/j.scitotenv.2019.135983.
Eini, M., Kaboli, H.S., Rashidian, M., Hedayat, H., 2020. Hazard and vulnerability in urban flood risk mapping: Machine learning techniques and considering the role of urban districts. Int. J. Disaster Risk Reduct., 50, Pp. 101687. DOI: 10.1016/j.ijdrr.2020.101687.
Elkhrachy, I., 2016. Flash Flood Hazard Mapping using satellite images and GIS tools: A case study of Najran City, Kingdom of Saudi Arabia (KSA). Egypt J Remote Sens Space Sci., 18, Pp. 261–278. DOI: 10.1016/j.ejrs.2015.06.007.
Farish, S., Munawar, S., Siddiqua, A., 2017. Flood Risk Zonation using GIS techniques: District Charsadda, 2010 Floods, Pakistan. Environ Risk Assess Remediat, 1, Pp. 29–35. DOI: 10.4066/2529-8046.100014.
Gitika, T., Ranjan, S., 2016. GIS-based Food Hazard Mapping: A case study in Krishna River basin, India. Egypt. J. Remote Sens Space Sci., 5, Pp. 50–59.
Guerriero, L., Ruzza, G., Guadagno, F.M., Revellino, P., 2020. Flood hazard mapping incorporating multiple probability models. J. Hydrol., 587, Pp. 125020. DOI: 10.1016/j.jhydrol.2020.125020.
Guha-Sapir, D., Hoyois, P.H., Below, R., 2016. Annual Disaster Statistical Review the Numbers and Trends. The Centre for Research on the Epidemiology of Disasters, Brussels, Pp. 1–2.
Hallegatte, S., Green, C., Nicholls, R.J., Corfee-Morlot, J., 2013. Future flood losses in major coastal cities. Nat. Clim. Chang., 3, Pp. 802–806. DOI: 10.1038/nclimate1979.
ISDR, 2023. Terminology on disaster risk reduction 1-35 [Internet]. [updated 2023 August 15; cited 2023 August 15]. Available from. http://www. unisdr.org/eng/terminology/terminology-2009-eng.html.
Liu, G., Tong, F., Tian, B., Gong, J., 2021. Finite element analysis of flood discharge atomization based on water–air two-phase flow. Appl. Math. Model., 81, Pp. 473–486. DOI: 10.1016/j.apm.2020.01.003.
Natural Resources Wales, 2016. Usk Management Catchment Summary [Internet]. [updated 2023 August 15; cited 2023 August 15]. Available from: https://naturalresources.wales (Accessed August 15, 2023).
Natural Resources Wales, 2017. River Usk Abstraction Licensing Strategy [Internet]. [updated 2023 August 15; cited 2023 August 15]. Available from: https://naturalresources.wales (Accessed August 15, 2023).
Ogato, G.S., Bantider, A., Abebe, K., Geneletti, D., 2020. Geographic information system (GIS)-Based multicriteria analysis of flooding hazard and risk in Ambo Town and its watershed, West shoa zone, oromia regional State, Ethiopia. J. Hydrol. Reg. Stud., 27, Pp. 100659.
Papaioannou, G., Loukas, A., Vasiliades, L., Aronica, G.T., 2016. Flood inundation mapping sensitivity to riverine spatial resolution and modelling approach. Nat. Hazards, 83, Pp. 117–132. DOI: 10.1007/s11069-016-2382-1.
Petroselli, A., Vojtek, M., Vojtekova, J., 2019. Flood mapping in small ungauged basins: A comparison of different approaches for two case studies in Slovakia. Hydrol. Res., 50, Pp. 379–392. DOI: 10.2166/nh.2018.040.
Rimba, A.B., Setiawati, M.D., Sambah, A.B., Miura, F., 2017. Physical flood vulnerability mapping applying geospatial techniques in Okazaki City, Aichi Prefecture, Japan. Urban Sci., 1, Pp. 1–22. DOI: 10.3390/urbansci1010007.
Sadeghi-Pouya, A., Nouri, J., Mansouri, N., Kia-Lashaki, A., 2017. Developing an index model for flood risk assessment in the western coastal region of Mazandaran, Iran. J Hydrol Hydromech., 65, Pp. 134–145. DOI: 10.1515/johh-2017-0007.
Saha, A., Praneeth, D.V.S., 2016. Flood vulnerability assessment by remote sensing and GIS based applications in West Bengal: A review. International Research Journal of Engineering and Technology, 3, Pp. 1654–1657.
Sharma, V.K., Rao, G.S., 2016. Amminedum E, Nagamani PV, Shukla A, Rao KRM, Bhanumurthy V. Event-driven flood management: design and computational modules. Geo Spat Inf Sci., 19, Pp. 39–55. DOI: 10.1080/10095020.2016.1151212.
Stefanidis, S., Stathis, D., 2013. Assessment of flood hazard based on natural and anthropogenic factors using analytic hierarchy process (AHP). 2013. Nat. Hazards, 68, Pp. 569–585. DOI: 10.1007/s11069-013-0639-5.
Woodruff, J.L., Dietrich, J.C., Wirasaet, D., Kennedy, A.B., Bolster, D., Silver, Z., Meldin, S.D., Kolar, R.L., 2021. Subgrid corrections in finite-element modeling of storm-driven coastal flooding. Ocean Model., 167, Pp. 101887. DOI:10.1016/j.ocemod.2021.101887.
Youssef, A.M., Hegab, M.A., 2019. Flood-Hazard Assessment Modeling Using Multicriteria Analysis and GIS: A Case Study—Ras Gharib Area, Egypt. In Spatial Modeling in GIS and R for Earth and Environmental Sciences. Elsevier: Amsterdam, The Netherlands, Pp. 229–257.
Zhao, G., Pang, B., Xu, Z., Peng, D., Xu, L., 2019. Assessment of urban flood susceptibility using semi-supervised machine learning model. Sci. Total. Environ., 659, Pp. 940–949. DOI: 10.1016/j.scitotenv.2018.12.217.
| Pages | 87-96 |
| Year | 2024 |
| Issue | 1 |
| Volume | 8 |
