
STUDY OF MOBILE FORMS OF MANGANESE IN THE WATERS OF SMALL RIVERS OF OUTER MANCHURIA ON THE EXAMPLE OF WATERCOURSES DRAINING THE TERRITORY OF KHABAROVSK AND ITS VICINITIES.
Journal: Water Conservation and Management (WCM)
Author: Kaminsky Oleg, Makarevich Konstantin, Sinkova Irina, Khomchenko Olga, Andreeva Diana, Burkova Anna, Kirichenko Evgeny
Print ISSN : 2523-5664
Online ISSN : 2523-5672
This is an open access article distributed under the Creative Commons Attribution License CC BY 4.0, which permits unrestricted use, distribution, and reproduction in any medium, provided the original work is properly cited
Doi: 10.26480/wcm.01.2025.18.21
Abstract
 The manuscript is devoted to the study of manganese content in small rivers of Outer Manchuria (on the example of the city of Khabarovsk and its surroundings), as well as the factors determining the content of this element in water. Sixteen watercourses were studied, and in 11 of them the natural manganese background was exceeded by a factor of 10-130 (i.e. 110-1320 μg/l on average). The comparison of the obtained data with the geochemical peculiarities of this area allows us to assume that the source of manganese intake may be iron-manganese nodules and products of their hydrolytic destruction. The influence of the permanganate index on manganese release is separated into spatial and temporal dynamics. As a result, the maximum of the manganese release process appears to be shifted relative to the time and place of permanganate index increase. An informative hydrochemical indicator for assessing the risk of release of toxic concentrations of manganese is the fraction of ammonium nitrogen. Each additional 15-20% NH3 corresponds to an increase in Mn concentration of 120 μg/l. This trend continues between 40 and 80% of the ammonium fraction and can result in the release of up to 480 μg/l Mn. Further increases in the NH3 fraction can lead to a release of Mn up to 1320 μg/l. This indicates the possibility of formation of new migration routes of this element initiated by anthropogenic impact on the territory of this region.
Keywords
Manganese, small rivers, urban areas, ammonium nitrogen, permanganate index
1. INTRODUCTION
As is known, transition metal ions are an integral component of the natural composition of the natural background characteristic of both surface and ground waters. For normal metabolic processes of many organisms it is necessary to regularly receive some optimal dose of these transition metals from the environment. Such transition metals are considered to be essential elements. Their intake is necessary both for normal course of repair processes in tissues and for growth and development of the organism as a whole. Manganese is an important element for metabolic processes of the human body. This element, for example, is necessary for the formation of arginase and glutamine synthetase. Such an important antioxidant mitochondrial enzyme as superoxide dismutase also requires manganese for its formation (Furbee and Dobbs, 2009). Manganese enters organisms mainly in the ionic form Mn2+.
Although manganese is an essential element, it is dangerous to human health in high levels. Manganese overdose is dangerous because of its neurotoxicity. For example, receiving high doses of manganese in childhood can cause the development of pathologies of the nervous system (Grandjean and Landrigan, 2014). The World Health Organisation has established a maximum manganese concentration of 0.1 mg/l for water supply systems (Usepa, 2004).
Manganese is an element with variable valence. In natural biogeocenoses and geological formations, conditions leading to the formation of manganese (II) and manganese (IV) compounds are mainly formed Recently, some researchers have paid attention to manganese (III) compounds, which are metastable in aqueous solutions but relatively stable when incorporated into minerals (Ma et al., 2023; Shi et al., 2020; Oldham et al. 2017).
Manganese occurs naturally in many surface waters and groundwater sources, as well as in soils that are eroded by these waters. However, human activities are also responsible for large amounts of manganese contamination of water in some areas. Manganese (II) enters the body mainly with food and drinking water, so its regular monitoring in such facilities is important (Crapnell and Banks 2022). Experimental studies and computer modelling show that dissolved Mn is very mobile and less prone to complexation compared to other trace elements such as Cu, Co, Ni, Pb or Zn (Abbasse et al., 2022; Charriau et al., 2011; Morgan, 2000).
Manganese is an example of a metal for which the influence of the content of organic pollutants on its migration activity is particularly significant. This is due to the fact that it actively participates in the redox hydrochemical processes with the organic component of pollution and dissolved oxygen in water, as a result of which it can be transferred from bottom sediments to the mobile ionic form Mn2+. Thus, due to reductive processes, manganese can be released from the fixed state and further migrate in water bodies for considerable distances.
For surface fresh waters the background manganese content is 10-50 μg/l. For waters of Khabarovsk city territories, the increased natural background manganese 200-300 μg/l is characteristic, not seldom it is registered up to 2000 μg/l, and in underground waters up to 8000 μg/l. This is due to the fact that the territory of Khabarovsk is part of the province of iron-manganese fresh waters (Kulakov 2013; Novikov et al., 2008). High manganese in waters is due to the presence of ironmanganese nodules of soils and the lower part of the Pliocene clay strata in the territory of outer Manchuria (Kulakov, 2013). Most literature data on manganese migration contain studies conducted for much smaller concentration ranges, the upper limit of which does not exceed 40 μg/l
(Superville et al., 2018). As a result, the conclusions on the behaviour of various forms of manganese obtained in such studies cannot be correctly transferred to water bodies for which the concentration range is characterized by much larger values with an upper limit of 5000-8000 μg/l, typical for the waters of Outer Manchuria.
2. MATERIAL AND METHODS
The territory of Khabarovsk and its vicinity is drained by 16 of the largest small rivers (Figure 1). These rivers are characterized by different anthropogenic impacts. Some rivers (12-16) flow through protected areas and have no anthropogenic influence. Some rivers have significant anthropogenic influence (1,3) (Shesterkin et al., 2021; Sinkova, et al., 2024).
The chemical composition of water was determined in the laboratory of the Collective Use Centre of the IWEP FEB RAS using standard methods (D, 2012). Sampling was carried out in accordance with regulatory documents (Gost, 2012; Gost, 2022; RD, 1996) in the period 2021-2024. The concentration of mobile manganese was determined using Agilent Technologies atomic absorption spectrometer: SpectrAA 240 FS AA.
3. RESULTS AND DISCUSSIONS
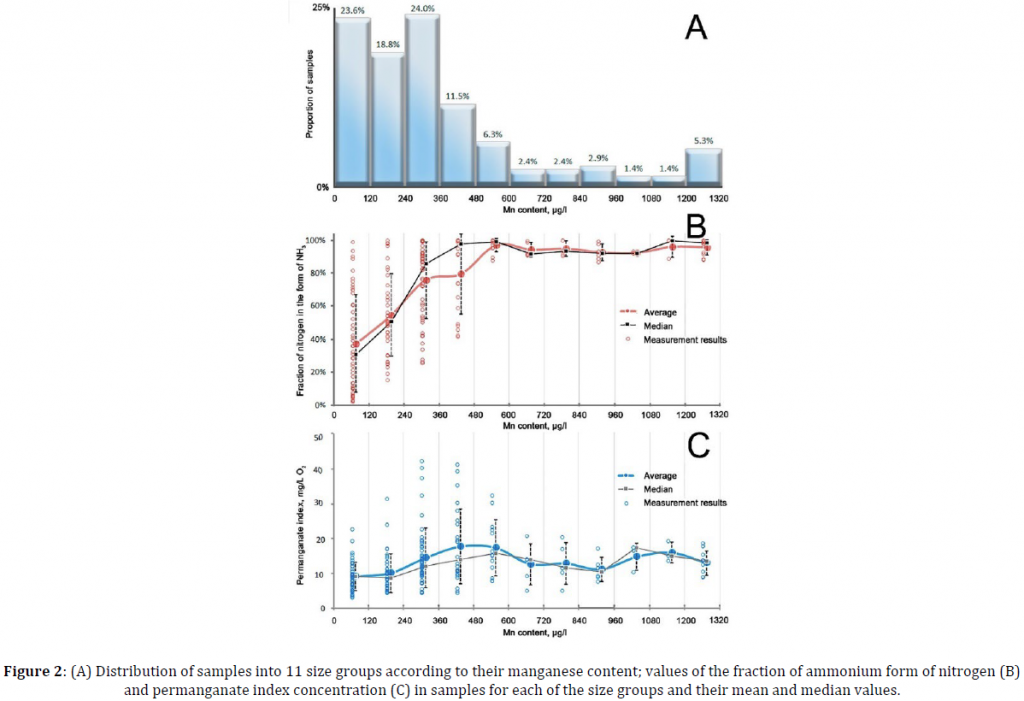
All studied samples were divided into 11 size groups depending on their manganese content. Accordingly, samples containing Mn from 0 to 120 μg/l were assigned to the size group (I), samples containing Mn from 120 to 240 μg/l were assigned to the size group (II). The remaining size groups were formed accordingly with 120 μg/l discretization, up to size group (XI). The distribution curve of samples by size groups is shown in Figure 2A. It can be clearly seen that the first four groups account for the major proportion (77.9%) of all samples. The distribution obtained does not have a clearly defined maximum. The maximums occur in size group (I) and group (III), accounting for 23.6 and 24.0%, respectively. The rest of the obtained data set accounts for 22.1% of the total samples collected. The results of these samples are relatively evenly distributed among the remaining size groups from (V) to (XI).
The obtained data indicate that, despite the absence of anthropogenic (industrial) sources of manganese in the majority of samples, the background values of this element are exceeded. At that, the first 3 size groups account for the main part of the sample (77.9%). For the rest of the samples exceeding the natural background is from 50 to 130 times.
In order to assess the degree of influence of permanganate index value and reducing hydrochemical environment on manganese content, the data on permanganate index and the share of nitrogen attributable to its reduced form (NH3) were compared with the manganese size group distribution described above. This comparison allowed the ranges of influence of both factors on manganese content to be identified. The results are presented in Figure 2 B, C. The dots show the permanganate index values and the fraction of ammonium form of nitrogen in the samples for each of the size groups.
As can be seen in Figure 2B, manganese in the concentration range 0-120 μg/l was observed in a very wide range of NH3 fraction values. The average value is 37.4%, while the median value is slightly lower at 30.9%. In samples containing 120-240 μg/l manganese, the proportion of reduced forms of nitrogen is more than 15%. The average value of 54.5%, as well as the median value of 50.6%. This indicates that a more pronounced reducing environment is required to release such concentrations of manganese.
The same trend was observed for samples containing 240-360 μg/l manganese. The minimum recorded fraction of ammonium nitrogen also slightly increases – 24%, and the average value is 75.8% (with a median of 85.6%).
Thus, analyzing the data on the first three size groups we can say that the increase in the intensity of reductive hydrochemical processes (estimated by the content of reduced forms of nitrogen) leads to an increase in manganese content. On average, an increase in the intensity of reductive processes corresponding to an increase in the proportion of ammonium nitrogen by every 15-20% led to an increase in manganese concentration by 120 μg each time.
The group of samples containing from 360-480 μg/l is characterised by the fact that the median value for it retains the previously described trend and increases up to 97.57%, while the average value remains close to the previous group.
Further analysis of the curve shows that in a hydrochemical environment in which the ammonium nitrogen content is more than 85% manganese between 480 and 1320 μg/l can be expected to be present. As can be seen from Figure 2A, the remaining samples were relatively evenly distributed between the remaining size groups up to and including XI.
Thus, the increase in the content of nitrogen in the reduced form can mark the growth of manganese concentration in the range up to 600 μg/l. At the same time, there is a pronounced trend for an increase in the average and median values of the ammonium form of nitrogen with increasing manganese concentration.
Ammonium ion is only a marker of formation of reductive hydrochemical atmosphere, but cannot act as a reducing agent for Mn. As is known, high concentrations of Mn in watercourses are formed: firstly, in anaerobic conditions characteristic of groundwater (Kulakov, 2013); secondly, at high concentrations of organic matter forming reducing conditions. Permanganate index was used to estimate the concentration of such organic matter. The data on the relationship between permanganate index and manganese concentration groups are presented in Figure 2C. As can be seen from the graph there is a moderately pronounced trend of increasing manganese concentrations from the mean permanganate index values in the first four size ranges (up to 480 μg/l). For the other
size groups (from 480 μg/l), the permanganate index values range from 11 to 13 mg/l O2. It should be noted that high concentrations of manganese are not associated with the highest of the recorded
permanganate index values. Probably, this fact is related to the fact that the influence of permanganate index on manganese release is dispersed in spatial and temporal dynamics. As a result, the maximum of the manganese release process appears to be shifted relative to the time and place of permanganate index increase, which induced this process.
The dynamics of changes in manganese concentrations in the bed of the Chernaya River (Figure 3A) made it possible to assess the impact of permanganate index on this value in one watercourse along the length of the channel. This river is characterized by a length of 32 km, draining areas with low anthropogenic influence 0-2.2 km, with agricultural enterprises and private farms 5.2-8.6 km and an area with minimal anthropogenic influence outside the city.
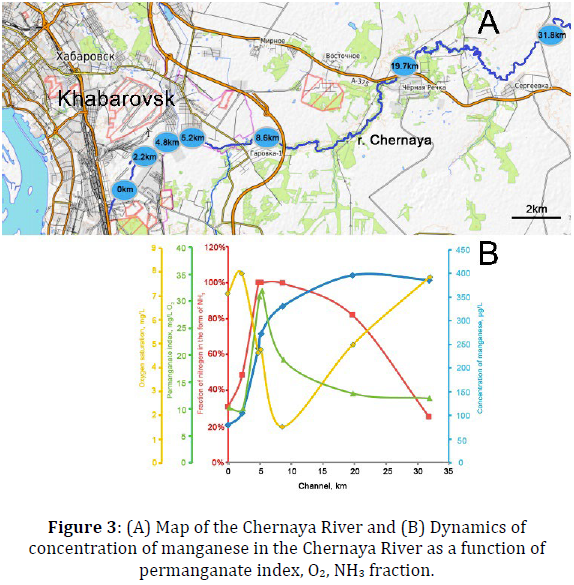
As can be seen from the graph (Figure 3A), of the seven sampling points, two are upstream of the effluent discharge point (points 0 km and 2.2 km) and the remaining five are downstream, respectively. Points 4.8 and 5.2 km are characterized by the maximum values of permanganate index, the value of which increases by a factor of 3. At the same time, there is an increase in the share of ammonium nitrogen up to 94%. Oxygen content decreases 2 times. The content of manganese, on the contrary, increases by more than 2 times. However, the highest concentration of manganese is registered not in this section of the river, but further downstream. The next sampling point, 8.6 km, is characterized by the most pronounced reductive hydrochemical environment: oxygen concentration is minimal and it is spent on oxidation of compounds that determine the magnitude
of permanganate index. Additional release of manganese occurs, but its highest concentration is recorded downstream. At 19.7 km, the permanganate index decreases to almost baseline values (see points 0 and 2.2 km), oxygenation is restored and ammonia nitrogen levels decrease. The manganese content reaches its maximum concentration. At the last point 31.8 km of the sampling route, all hydrochemical parameters are restored to their initial values, but the manganese content does not change significantly and remains close to the maximum values recorded for this sample series. Thus, the manganese concentration does not decrease despite the restoration of the previous level of water oxygenation and the formation of an oxidising hydrochemical environment in which there are no reduced forms of nitrogen and the permanganate index content is close to the initial values for this watercourse.
4. CONCLUSIONS
The study of manganese content in small rivers of the outer Manchuria (on the example of Khabarovsk city) showed an excess of natural background manganese from 10 to 130 times (which is on average 100 – 1320 μg/l). This is a consequence of manganese release from the products of hydrolytic destruction of iron-manganese nodules.
It is shown that the most informative hydrochemical indicator to assess the degree of expression of reductive processes leading to the release of manganese is the share of low valence forms of nitrogen (NH3) from the total content of inorganic nitrogen (NTotal). It is shown that the increase in the share of ammonium nitrogen for every 15-20% leads to the release of 120 μg/l of manganese. This trend is maintained between 40 and 80% of the ammonium fraction and can lead to the release of up to 480 μg/l Mn. A fraction greater than 80% results in the release of up to 1320 μg/l Mn.
High manganese concentrations are not confined to the highest reported permanganate index values. This fact is probably due to the fact that the effect of permanganate index on manganese release is separated in spatial and temporal dynamics. As a result, the maximum of the manganese release process appears to be shifted relative to the time and place of permanganate index increase, which induced this process.
ACKNOWLEDGMENT
The research was funded by the grant Russian Science Foundation № 24-17-20002, https://rscf.ru/project/24-17-20002/ and contracts with the Government of Khabarovsk Region agreement № 100C/ 2024
REFERENCES
Abbasse, G., Ouddane, B., Fischer, J.C., 2002. Determination of total and labile fraction of metals in seawater using solid phase extraction and inductively coupled plasma atomic emission spectrometry (ICP-AES). J. Anal. At. Spectrom. 17, Pp. 1354–1358. https://doi.org/10.1039/B203407G
Charriau, A., Lesven, L., Gao, Y., Leermakers, M., Baeyens, W., Ouddane, B., Billon, G., 2011. Trace metal behaviour in riverine sediments: role of organic matter and sulfides. Appl. Geochem. 26:80–90. https://doi.org/10.1016/j.apgeochem.2010.11.005
Crapnell, R.D., Banks, C.E., 2022. Electroanalytical overview: The determination of manganese. Sensors and Actuators Reports. 4,100110, ISSN 2666-0539.https://doi.org/10.1016/j.snr.2022.100110.
D 52.24.353-2012 ‘Sampling of land surface water and treated wastewater’
Furbee, B., Dobbs, M.R., 2009. CHAPTER 26 – manganese. Clinical Neurotoxicology. W.B. Saunders, Philadelphia. Pp. 293 – 301. https://doi.org/10.1016/B978-032305260-3.50032-0
GOST 31861-2012. Water. General requirements for sampling, (from 01.01.2023 GOST R 59024-2020).
GOST 17.1.5.05-85 ‘Hydrosphere. General requirements for sampling of surface and sea waters, ice and atmospheric precipitation’ (from 01.01.2023 GOST R 70282-2022).
Grandjean, P., Landrigan, P.J., 2014. Neurobehavioural effects of developmental toxicity. Lancet Neurol. 13, Pp. 330 – 338. http://dx.doi.org/10.1016/S1474-4422(13)70278-3
Kulakov, V.V., 2013. Use of in-situ purification of groundwater from iron and manganese (on the example of water supply of Khabarovsk). Vestnik FEB RAS. 2013
Ma, A., Huang, Y., Mao, S., Li, S., Zhu, Z., Li, M., Liu, H., 2023. “Mn(II) Curtain” in the riparian sediment at the lower reaches of the Hanjiang River, China. Journal of Hydrology. 625, A, 130047, 0022-1694.10.1016/j.jhydrol.2023.130047
Morgan, J.J., 2000. Manganese in natural waters and earth’s crust: its availability to organisms. Metal Ions in Biological Systems. Manganese and Its Role in Biological Processes. 37
Novikov, V.M., Shkolnik, E.L., Zhegallo, E.A., Orleansky, V.K., 2008. Features of formation of hypergenic iron-manganese nodules (Russian Far East, Vietnam). Pacific Geology. 27, 5, 53-64.
Oldham, V.E., Mucci, A., Tebo, B.M., Luther, G.W., 2017 Soluble Mn(III)–L complexes are abundant in oxygenated waters and stabilized by humic ligands. Geochimica et Cosmochimica Acta. 199, 238-246, ISSN 0016-7037. https://doi.org/10.1016/j.gca. 2016.11.043
RD 52.18.595-96 ‘Federal list of measurement techniques allowed for use when carrying out works in the field of environmental pollution monitoring’.
Usepa, 2004. Drinking Water Health Advisory for Manganese. U.S. Environ. Prot. Agency Off. Water Washington, DC EPA-822-R-04-003. 2004, Pp. 1 – 49. doi:EPA- 822-R-04-003
Shesterkin, V. P., Sinkova, I. S., Kaminsky, O. I., 2021. Dynamics of the Content of Mineral Forms of Nitrogen in the Water of Small Rivers in Khabarovsk during the Winter Period. Journal of Ecological Engineering. 22, 10, Pp. 121-126. DOI 10.12911/ 22998993/142120
Shi, C., Bangjing, D., Yunbin, Q., Zhihao, C., Zhengkui L., 2020. Nitrogen loss through anaerobic ammonium oxidation mediated by Mn(IV)-oxide reduction from agricultural drainage ditches into Jiuli River, Taihu Lake Basin. Science of The Total Environment. 700, 134512, ISSN 0048-9697. https://doi.org/10.1016/j.scitotenv.2019.134512
Sinkova, I.S., Shesterkin, V.P., Shesterkina, N.M., Makarevich, K.S., Kaminsky, O.I., 2024. Anthropogenic influence on the chemical composition of water of small rivers of Khabarovsk in winter low water. Geography and Natural Resources. 45, 3, Pp. 91-97. DOI 10.15372/GIPR20240309. EDN HFPIUC
Superville, P. J., Ivanovsky, A., Bhurtun, P., Prygiel, J., Billon, G., 2018. Diel cycles of reduced manganese and their season alvariability in the Marque River (northern France). Science of The Total Environment. 624, Pp. 918-925 https://doi.org/10.1016/j.scitotenv. 2017. 12.189
| Pages | 18-21 |
| Year | 2025 |
| Issue | 1 |
| Volume | 9 |
