
THE APPLICATION OF CARBON DOTS FROM SAWDUST AS ADSORBER OF LEAD METALS (Pb) IN CILIWUNG RIVER
Journal: Water Conservation and Management (WCM)
Author: Istie Rahayu, Vera Indriaswari, Wayan Darmawan, Esti Prihatini, Rohmat Ismail, Gilang Dwi Laksono
Print ISSN : 2523-5664
Online ISSN : 2523-5672
This is an open access article distributed under the Creative Commons Attribution License CC BY 4.0, which permits unrestricted use, distribution, and reproduction in any medium, provided the original work is properly cited
Doi: 10.26480/wcm.01.2025.72.80
Abstract
 Carbon dots (C-dots) are zero-dimensional nanomaterials with excellent fluorescence and metal adsorption properties. In this study, carbon dots (C-dots) were synthesized from fast-growing wood sawdust waste using a hydrothermal method. The objective of this research is to characterize C-dots derived from fast-growing wood sawdust with the addition of a passivation agent using a hydrothermal method and to evaluate the efficacy of the synthesized C-dots as a sorbent for dyes and Pb, as well as a Pb detector in water. The synthesis of C-dots has been successfully demonstrated through the observation of blue fluorescence in solution. The optical properties testing yielded absorbance peaks within the ultraviolet wavelength range (200-400 nm), indicative of electron excitation within the chemical bond. The formation of C-dots is corroborated by the results of the FTIR test, which demonstrates the existence of functional groups on the surface of C-dots. The fluorescence spectrum exhibits the highest emission intensity value at a wavelength of 454 nm. Fast-growing wood sawdust-derived C-dots demonstrated efficacy in dye and Pb (II) metal adsorption, exhibiting high adsorption capacity for metal ions. This study revealed that the concentration of Pb metal in river water can be diminished using C-dots. Different formulations exhibited varying degrees of effectiveness in Pb metal adsorption.
Keywords
Adsorption, C-dots, hydrothermal, lead metal, sawdust.
1. INTRODUCTION
Water sources have been extensively employed for a multitude of purposes, including agriculture, industry, domestic use, the construction of water storage facilities, and numerous other applications. As the global population continues to grow, the water sources that are currently utilized by communities are increasingly subjected to pollution, which is reducing the quality of available water. This is a significant issue that will require urgent attention in the future. The deterioration in water quality will result in a reduction in its usability, adverse effects on the health of living organisms, and a decline in the value and potential of natural resources (Asrini et al., 2017). The quality of water can be influenced by the quality of the water supply, which is dependent on human activities. The current issue is the indiscriminate disposal of industrial and household waste. The presence of heavy metals and harmful dyes in water that has not undergone an appropriate management process represents a significant environmental contamination risk (Han and Liu 2024).
The failure to implement an effective wastewater management process has the potential to result in environmental contamination, which in turn can lead to a range of adverse effects on human health and well-being, as well as on the overall productivity of the community. It is therefore necessary to identify a solution to enhance the quality of polluted water, with the potential of nanotechnology offering a promising avenue for this. The most extensively researched area of carbon-based nanotechnology is the development of carbon nanoparticles (C-dots). Carbon dots (C-dots) are carbon-based nanoparticles with a diameter of less than 10 nm, exhibiting a zero-dimensional structure (Wang and Hu 2014). Carbon dots (C-dots) offer a number of advantages, including high-intensity fluorescence, stable chemical properties, an environmentally friendly profile, relatively low production costs, straightforward synthesis and application, and high solubility in water (Sun and Lei 2017). The detection of heavy metals in polluted water is crucial as metal ion contamination can lead to environmental pollution and detrimental cumulative effects on living organisms (Zou et al., 2015).
The synthesis of C-dots can be achieved through two main methodologies, namely through bottom-up and top-down methods. The bottom-up method comprises a series of relatively straightforward stages in comparison to the top-down method (Etefa et al., 2024). One of the most frequently employed bottom-up methods is the hydrothermal method. This method is classified as a straightforward synthesis technique due to its reliance on reactor-based heating. The synthesis of C-dots by the hydrothermal method is a heterogeneous chemical reaction that occurs with aqueous solvents under high pressure and temperature conditions. In some instances, the incorporation of passivation agents is necessary to yield C-dots with defined chemical reactivity (Li and Dong, 2018).
The capacity of C-dots to identify heavy metal ions has been validated through the assessment of their fluorescence intensity, a process that has been subjected to scientific scrutiny (Li and Li, 2021). One of the heavy metals that has been identified as a pollutant in river water is lead (Pb). Lead metal is classified as a type of heavy metal that is considered a hazardous pollutant. Lead is predominantly found in aqueous environments, and its accumulation can have detrimental effects on human and animal health. As posited the ingestion of Pb metal has been linked to a reduction in cognitive abilities, stunted growth, and even paralysis in children by (Widayatno et al., 2017). Furthermore, the symptoms of Pb metal poisoning can include nausea, anemia, and abdominal pain.
One of the carbon sources employed in the synthesis of C-dots is fastgrowing wood sawdust waste. If left unaddressed, this waste can have a detrimental impact on the environment, necessitating its repurposing to ensure its environmental value is retained (Olaiya, Lawan, and Olonade 2023). This research employs fast-growing wood sawdust due to its abundant availability. Materials comprising cellulose have the potential to serve as a source of C-dots, as evidenced by the potential of fast-growing wood sawdust waste to do so (Sa’diyah et al., 2021). Cellulose is also a naturally abundant polymer that can be utilized as a source material for the synthesis of C-dots (Shen et al., 2016; da Silva Souza et al., 2018). The objective of this study is to characterize C-dots derived from fast-growing wood sawdust in the presence of passivation agents via the hydrothermal method and to evaluate the efficacy of C-dots synthesized from fastgrowing wood sawdust as a dye sorbent, Pb metal detector, and sorbent in river water.
2. MATERIAL AND METHODS
2.1 Materials
Materials The materials used were fast-growing wood sawdust, methylene blue (MB) (Merck), 1000 ppm Pb metal stock (Merck), citric acid (Merck), urea (Merck), and demineralized water. The following tools were utilized in the study: an oven (Memmert UNB 400), furnace (Thermolyne FB1410m-33), 100 mL goblet, 100 mL measuring cup, 250 mL, 500 mL, 100 mesh sieve, UV LED flashlight, sonicator (Cole-Palmer), pipette, sudip, 30 mL porcelain cup, centrifuge (GEMY PLC 05), hydrothermal autoclave, and 100 mesh sieve. Subsequently, the resulting C-dots solution was subjected to characterization tests utilizing a Fourier Transform Infrared Spectrometer (FTIR), a UV-Vis spectrophotometer, and a fluorescence spectrophotometer.
2.2 Sample Preparation and C-dots Synthesis
The work comprises the following steps: preparation of raw materials, preparation of fast-growing wood sawdust samples, preparation of C-dots using the hydrothermal method, and testing and characterization.
2.2.1 Raw Material Preparation
The raw materials were procured from the Forest Products Department workshop at IPB University. The fast-growing wood sawdust was obtained from a mixture of several types of fast-growing wood, including jabon wood (Anthocephalus cadamba Miq.), sengon wood (Falcataria moluccana), teak wood (Tectona grandis), and Mangium wood (Acacia mangium).
2.2.2 Sample Preparation of Fast-Growing Wood Sawdust
A quantity of 1 kg of fast-growing wood sawdust was subjected to solar drying until it reached a moisture content of zero. Subsequently, the dried fast-growing wood sawdust is placed within a drum furnace to undergo combustion. The sample is placed into the drum from the top and then ignited by burning the air hole at the bottom until the charring process is complete. Subsequently, the resulting charcoal is filtered using a 100-mesh sieve (Jaouadi 2021).
2.2.3 Synthesis of (C-dots) using Hydrothermal Method
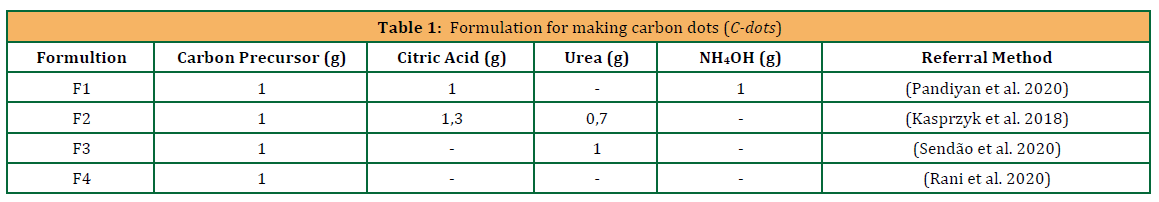
Subsequently, 1 gram of carbon was combined with demineralized water in a glass beaker, and the passivation agents were introduced in accordance with the specifications outlined in Table 1. Subsequently, the solution was placed in a hydrothermal autoclave and heated in an oven at 200°C for six hours. Subsequently, the solution resulting from the hydrothermal process was homogenized using a sonicator and subjected to further separation through centrifugation. Moreover, the supernatant phase, obtained following centrifugation, was subjected to drying in an oven.
2.3 Characterization of C-dots
2.3.1 Fourier Transform Infrared Spectrometry (FTIR)
The C-dots samples were combined with potassium bromide (KBr) of spectroscopic grade at a ratio of 1:100 (mass:mass), compressed into thin pellets, and analyzed via FTIR (Nicolet 6700 Thermo Scientific, USA) within the wave number range of 4000 to 400 cm⁻¹.
2.3.2 Fluorescence Spectrophotometer
The Horiba FluoroMax-4 emission spectrometer (Irvine, CA, USA) was used to determine the fluorescence emission capacity of the synthesized C-dots at a specific excitation wavelength; a 200 ppm C-dots solution in 50 mL demineralized water was prepared, measured with excitation parameters of 360 nm, and emission spectra were recorded from 375 to 700 nm, compared against a blank of demineralized water under identical conditions (Lin et al., 2014).
2.3.3 UV-Vis Spectrophotometer
The UV-Vis absorption spectra of 200 ppm C-dots samples were scanned with a UV-Vis spectrophotometer (Shimadzu 1800, Japan) using a quartz cuvette in the wavelength range of 200 to 800 nm, and the quantum yield value was calculated using a quinine sulfate standard and an equation from Zhang, Liu, and Li (2023).
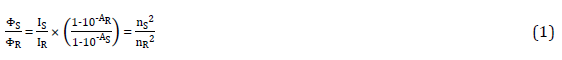
Where, ΦS is quantum yields of sample, ΦR is quantum yields of standard, IS is emission intensity of the sample, IR is emission intensity of the standard, AS is sample absorbance, AR is standard absorbance, nS is refractive index of the sample solvent, and nS is refractive index of the standard solvent
2.4 C-Dot as Metal Pb and Methylene Blue Adsorbent
2.4.1 Pb(II) adsorption test
A total of 0.5 grams of C-dots sample was added to a Pb2+ solution with a concentration of 5000 ppm and then stirred until homogeneous. The sorption efficiency of C-dots was determined based on different contact times. The contact times used in this study were 30, 60, and 120 minutes (Raymond et al. 2023). Next, 5 mL of each solution was sampled based on different contact times and then transferred to a 50 mL volumetric flask, then 0.1 M HNO3 solution was added to the mark. The solution was again diluted up to 100x by pipetting up to 0.5 mL and measured in a 50 mL volumetric flask, so that the total dilution was 1000x. The Pb solution that has reacted with C-dot adsorbent and has been diluted was then read for absorbance using an atomic absorption spectrophotometer (AAS) (Shimadzu AA-7000).
2.4.2 Dye Adsorption Test
The dye adsorption test was performed by preparing a solution of methylene blue (MB) as much as 10 ml of MB with a concentration of 10 ppm, which was added to 0.01 g of synthesized C-dots. The mixed solution was homogenized and left at room temperature for 24 hours. Then the MB solution was measured by UV-Vis spectrophotometer at a wavelength of 665 nm (Zhao et al. 2019). The amount of adsorbed MB concentration was calculated based on the difference between the initial concentration value of MB without adsorbent and after adsorption by C-dots adsorbent.
2.4.3 Testing of Metal Ion Sensor
The testing of the metal sensor employs a solution of C-dots with a concentration of 200 ppm. A solution of Pb2+ metal in the amount of up to 10 mL was added to the C-dots solution in order to evaluate the sensitivity of the latter to metals. Subsequently, the combined solution was transferred to a glass tube and subjected to ultraviolet (UV) irradiation at a wavelength of 366 nm (Yoo et al. 2019). Qualitative documentation of changes in fluorescence intensity and color was conducted through the use of a camera.
2.4.4 Adsorption of Pb Metal from River Water
The sampling of river water is in accordance with the standards set forth in SNI 6989.59:2008, Which Pertains to Water and Wastewater Part 59: Wastewater Sampling Method. This method is employed for the purpose of sampling water for the purpose of testing the physical and chemical properties of wastewater. The water sample utilized is Ciliwung river water, with the selection of sampling locations conducted at two points: the Katulampa Dam river and the river flow in Sempur, Bogor City, West Java, Indonesia. The water sampling technique employed was that of grab samples, which are defined as water samples taken once from a single location. Subsequently, water samples were collected directly from the river using plastic bottles. A chemical solution of H2SO4 was utilized as a preservative.
The adsorption test was conducted by weighing a 0.1-gram sample of C-dots, which was then introduced into 100 milliliters of river water sample and stirred until homogeneous. Subsequently, the sample was transferred into a plastic bottle and permitted to stand for 24 hours at room temperature. Subsequently, the solution was diluted 10-fold via pipetting, with 5 mL transferred into a 50-mL volumetric flask for measurement. The concentration of Pb in the control and treatment river water samples was calculated by plotting the data against the Pb standard curve, which was analyzed by AAS (Shimadzu AA-7000).
2.5 Data Analysis
This study employed the analytical descriptive method. The research presentation is organized in a descriptive manner, and the results of the research are analyzed so that a conclusion can be drawn. The data collected were processed quantitatively using Origin 8.5, (Northampton, USA), Microsoft Excel, and Image J software (New York, USA). Qualitative data were obtained through observations and presented in the form of photographs and narrated in descriptive form.
3. RESULT AND DISCUSSION
3.1 Synthesis of C-dots
C-dots were synthesized using fast-growing wood sawdust, which is known to contain a multitude of carbon sources. The cellulose present in wood serves as a carbon source during the synthesis process. The synthesis method employed in this study is the hydrothermal method, which involves the breakdown of bulk carbon molecules into smaller units to form nanoparticles and induce a luminescent effect known as the quantum effect (Kong et al., 2024).
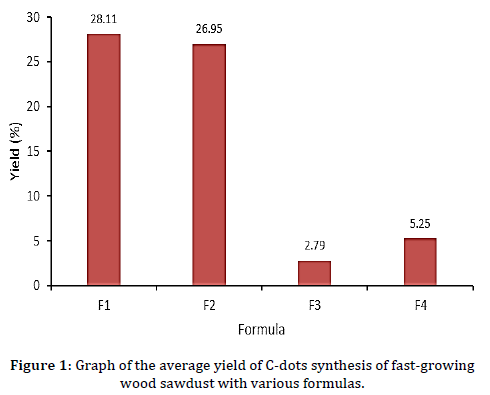
The yield obtained is the weight of the resulting product from the chemical reaction of the C-dots synthesis, calculated according to the specified formula. The resulting C-dots yield is in the form of a thick liquid (paste) of black color that has not fully dried for F1, F2, and F3, and black powder for F4. This indicates that the C-dots exhibit hygroscopic properties and are readily soluble in water. This finding aligns with the conclusions of Meiling et al., (2018), who asserted that the form of yield from the synthesis of C-dots can be powder, paste, or thick liquid. As illustrated in Figure 2, the mean yield for each formula, from F1 to F4, is 28.11%, 26.95%, 2.79%, and 5.25%, respectively. The highest average yield (28.11%) was observed for C-dots synthesized with a citric acid passivation agent, while the lowest average yield (2.79%) was observed for F3 C-dots. The elevated yield can be attributed to the incorporation of the passivation agent (Formulation in table 1). It has been demonstrated that citric acid can serve as a carbon source in the synthesis of C-dots (Sugiarti and Darmawan, 2015). The presence of passivation agents in the form of citric acid and urea serves as a carbon source, facilitating the addition of new functional groups to the surface of C-dots. Furthermore, the incorporation of nitrogen atoms during the synthesis of C-dots can enhance its mass, thereby facilitating the production of greater yields of C-dots (Nuryadin et al., 2016).
3.2 Characterization of C-dots
3.2.1 C-dots Fluorescence
Fluorescence is defined as the process of emitting light radiation by a material after experiencing excitation by a high-energy light beam (Lubis et al., 2016). The visual determination of the presence of C-dots synthesized can be achieved through the observation of their fluorescence characteristics. Fluorescence analysis was conducted by illuminating the C-dot solutions of all formulas with a UV lamp at 366 nm. The results of the qualitative analysis are presented in Figure 2. The results demonstrate the successful synthesis of C-dots in all formulations. This is corroborated by the observation of blue fluorescence in F1, F2, and F3, and greenish fluorescence in F4.
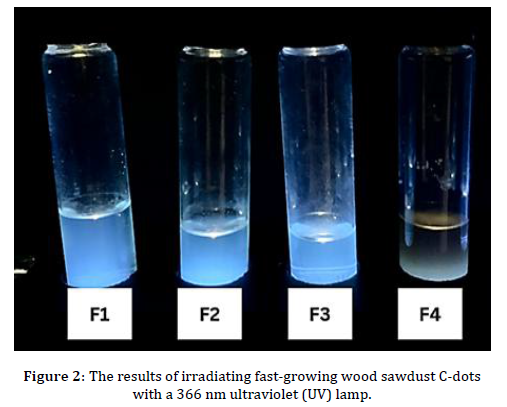
Figure 2 illustrates the varying fluorescence intensities observed for each formula. The addition of passivating agents during the synthesis of C-dots resulted in a notable increase in fluorescence intensity, as observed in F1, F2, and F3. Conversely, the absence of passivating agents in the synthesis of C-dots, as seen in F4, led to a reduction in fluorescence intensity. The high fluorescence intensity is a consequence of the utilization of disparate passivation compounds in each formula. The passivation agent plays a role in the stability of the surface state of C-dots, thereby increasing the ability of the latter to emit fluorescence. The functional groups of the passivation compound on the surface of C-dots can result in either an increase or a decrease in the resulting fluorescence intensity (Neikov and Yefimov, 2019). The presence of residual lignin, hemicellulose, and cellulose compounds in wood sawdust can facilitate the formation of carbonyl (C-O) and hydroxyl (O-H) groups on the surface of C-dots, thereby enhancing the fluorescence intensity (Yan et al., 2018).
3.2.2 C-dots Fluorescence Emission Spectrum
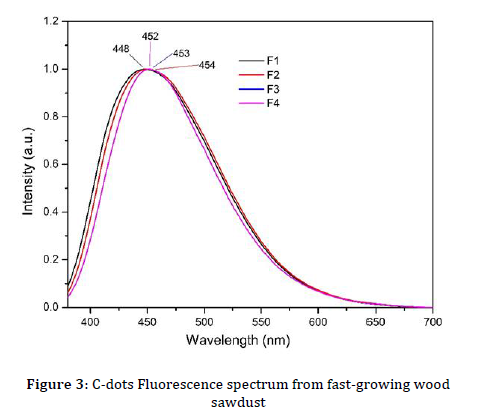
As stated fluorescence is defined as the process of emitting light radiation following excitation by a high-energy light beam by (Shiddiq and Umami, 2016). The objective of this test is to ascertain the wavelength of emission produced by C-dots. The parameters of the fluorescent properties of C-dots are determined by the highest fluorescent intensity at the maximum emission wavelength. The application of C-dots in the field of metal detection is contingent upon the optical properties of C-dots, which are in turn influenced by their fluorescent properties. The characterization of C-dots based on fast-growing wood sawdust was conducted using a fluorescent spectrophotometer, with the objective of determining the level of fluorescent intensity and the maximum wavelength of emission produced.

Figure 3 depicts the fluorescence spectrum of C-dots derived from fast-growing wood sawdust. The graph illustrates that the fluorescence intensity of C-dots is consistent across all formulas, yet the wavelengths exhibit variation. The mission waves produced by F1 to F4, in order of appearance, are at wavelengths of 448 nm, 454 nm, 453 nm, and 452 nm, respectively. It can be observed that the four formulas exhibit emission waves that are largely similar, with comparable fluorescent intensity results. The addition of citric acid and urea during the C-dots synthesis results in the largest emission wavelength, which is 454 nm. As previously observed the C-dots synthesized fluorescence emission spectrum with the addition of citric acid-urea, when excited at a wavelength of 370 nm, exhibited a maximum emission at a wavelength of 438 nm by (Seedad et al., 2021). Moreover, research conducted demonstrated that C-dots synthesized with the addition of urea exhibited the greatest wave emission at 410 nm when excited at 330 nm by (Shen et al., 2016). In conclusion, the present study is consistent with previous research in that the emission wavelength of C-dots falls within the visible light range, between 400 and 800 nm.
3.2.3 UV-Vis Spectrophotometer and Quantum Yields of C-dots
The objective of testing is to ascertain the optical characteristics of C-dots through the analysis of the absorption intensity peak (Anggraini and Dwandaru, 2021). As illustrated in Figure 4, the absorption peaks resulting from electron transitions for F1, F2, and F3 are observed at wavelengths of 229 nm, 223 nm, and 214 nm, respectively. In contrast, the absorption peaks resulting from the transition occurred at wavelengths of 330 nm, 334 nm, and 345 nm for F1, F2, and F4, respectively.
The greater intensity of the absorbance value indicates a greater number of electrons moving in the excitation region and is directly proportional to the amount of emission measured. These findings align with those of previous research which identified the presence of absorption peaks at wavelengths between 210 and 280 nm, indicative of transitions (Monday et al., 2021). The analysis also reported the occurrence of transitions at wavelengths between 320 and 380 nm (Jiang et al., 2017). The elevated absorbance intensity of C-dots indicates that the solution is more concentrated, containing a substantial number of C-dots and a considerable quantity of passivation agent functional groups at the same concentration (Putro and Maddu, 2019).
The efficiency of photon emission produced by a material is represented by the concept of quantum yield (Hamilton and Sanabria, 2019). Quantum yields are defined as the sum of the ratio of the fluorescent intensity produced by C-dots to the absorbed absorbance power.
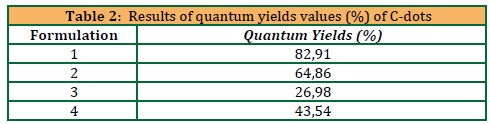
As evidenced in table 2, the quantum yield value of C-dots with the incorporation of a citric acid passivation agent and NH4OH reaches its maximum at 82.91%. As stated the incorporation of functional groups on the surface of C-dots can be achieved through the introduction of passivation agents by (Li and Dong 2018). The addition of urea and NH4OH compounds contributes to the addition of nitrogen atoms, while the addition of citric acid contributes to the addition of carbonyl functional groups. As indicated the incorporation of nitrogen atoms and hydroxyl groups represents an effective approach for the C-dots synthesis with high quantum yields by (Ren et al., 2020). The findings of this study are consistent with those of previous research, wherein demonstrated that C-dots produced with the addition of nitrogen atoms derived from citric acid exhibit high quantum yields (Qin et al. 2021).
The C-dots synthesis with water solvents has been observed to result in the production of quantum yields that are typically high, with an increase in yield occurring at elevated temperatures during the synthesis process. This yield reaches a maximum at 200°C, as reported by (Nallayagari et al., 2022). This finding aligns with the reaction temperature employed in the present study, which was set at 200°C. In contrast, C-dots with a urea passivation agent exhibited the lowest quantum yield value of 26.98%, indicating that the addition of urea with a water solvent did not notably enhance the quantum yield of C-dots. The efficacy of C-dots as heavy metal sensors is contingent upon two factors: fluorescence intensity and quantum yields. An elevated quantum yield value for C-dots is directly proportional to the fluorescence produced. The optimal detection of heavy metals is achieved through the use of high-quality C-dots with strong fluorescence (Li and Li 2021).
3.2.4 FTIR testing of C-dots
FTIR can be employed to characterize the surface functional groups of C-dots. These groups are of significant consequence with respect to the adsorption properties and reactivity of C-dots. It is of great significance to comprehend the mechanism of interaction between C-dots and metal ions (Mohammed et al., 2023). The absorption pattern is formed by each functional group, thereby enabling the identification of the presence of functional groups in a given material (Elina et al., 2023). The results of the analysis, as illustrated in Figure 9, indicate the presence of N-H functional groups on F1 to F3 and O-H on F4 on the surface of C-dots with consecutive wave numbers, specifically 3429 cm⁻¹, 3440 cm⁻¹, 3462 cm⁻¹, and 3422 cm⁻¹. The N-H functional group originates from the framework of urea and ammonium hydroxide compounds. Moreover, the hydrophilicity and stability of C-dots in solution will be enhanced if there are O-H and N-H groups present. The formation of hydroxyl (O-H) functional groups is a consequence of the interaction between water from free air and the surface of C-dots, resulting from the presence of carboxylic acid compounds within the framework of the material (González-González et al., 2022).
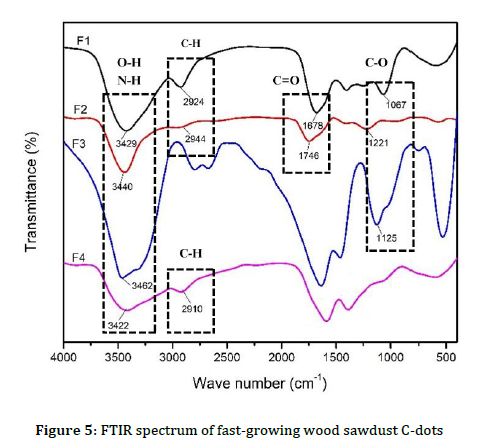
The carbonyl (C=O) functional group on citric acid is also present on the surface of C-dots, where the C=O functional group (carboxyl group) is observed at wave numbers 1678 cm⁻¹ (F1) and 1746 cm⁻¹ (F2). The C-H functional groups were observed at wave numbers 2949 cm⁻¹, 2944 cm⁻¹, and 2910 cm⁻¹ for F1, F2, and F4, respectively. Additionally, F1, F2, and F3 exhibited the presence of C-O functional groups at wave numbers of 1067 cm⁻¹, 1221 cm⁻¹, and 1125 cm⁻¹, respectively. As stated the presence of C-O groups is indicative of residual lignin present in wood by (Sugito and Rachmad Setiawan, 2022). The observed absorption peaks of the functional groups suggest the interaction between the functional groups of the passivation agent in each formula and the surface of the C-dots.
3.2.5 Metal Ion Pb2+ Sensor Testing
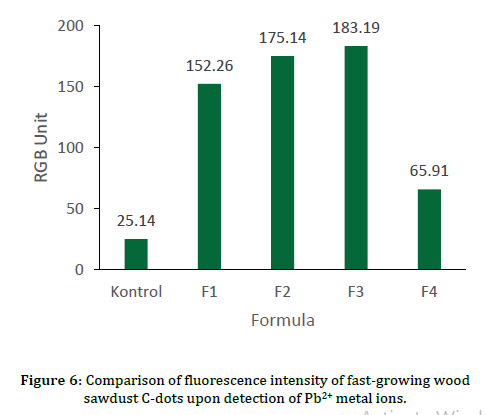
The development of C-dots as a metal ion sensor has been widely conducted due to their low toxicity, high chemical stability, and environmentally friendly nature (Prasasti et al., 2022). The objective of this test is to ascertain the efficacy of C-dots as a Pb²⁺ metal ion sensor in aqueous solutions. The quantitative assessment of fluorescence intensity is conducted through the utilisation of the ImageJ software. Figure 6 illustrates that the highest Red Green Blue (RGB) value was obtained from F3 C-dots, with a value of 183.19, while F4 exhibited the lowest RGB value, with a value of 65.91. The C-dots formulas exhibited RGB values exceeding that of the control, indicating their efficacy as Pb2+ metal ion sensors with varying detection capabilities across the formulas. The functional groups present in C-dots exhibit selective properties that enable the detection of heavy metals in aqueous solutions. As stated the presence of functional groups, including -COOH, -NH2-, and -OH, contributes to the high solubility of C-dots in water by (Ren et al., 2020). The hydroxyl and carboxyl functional groups facilitate interactions between the functional groups and the Pb²⁺ metal ions, resulting in a bound complex. The C-dots fluorescence properties are a determining factor in the success of C-dots in Pb²⁺ metal detection (Liu et al., 2023).
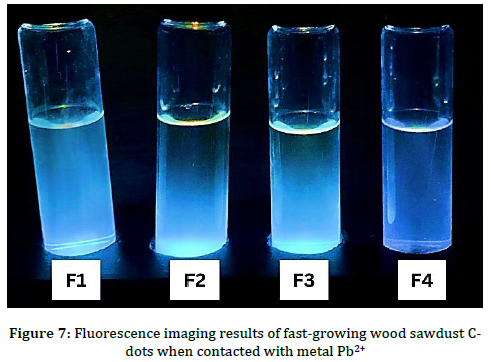
The detection mechanism is based on changes in fluorescence intensity resulting from the interaction of C-dots with heavy metal ions. The observation revealed that F4 C-dots exhibited the lowest fluorescence intensity when in contact with Pb2+ metal. The low fluorescence intensity is a consequence of the absence of passivation agents, which precludes the formation of additional functional groups that could otherwise enhance the C-dots fluorescence. Conversely, C-dots with the addition of urea exhibited the brightest fluorescence intensity among all formulas when contacted with Pb2+ metal. This finding is corroborated by the data presented in Figure 7, which illustrates that F3 exhibits the highest fluorescence intensity. The incorporation of passivation agents during the C-dots synthesis can enhance the selectivity of its interaction with metal ions through the introduction of active functional groups on the C-dots surface. The addition of urea is a valuable approach for enhancing the functionality of the carbon surface and serving as a carbon source (Yoo et al., 2019). Therefore, C-dots, a sustainable natural resource, can be employed as a biosensor for Pb2+ metal ions in water. The use of C-dots offers several advantages, primarily due to their environmentally friendly nature and the ease with which they can be obtained (Raveendran and Kizhakayil, 2021).
3.2.6 Lead (Pb) Metal Adsorption Testing
This test employs the atomic absorption spectrophotometry (AAS) method, which is based on the absorption of light by atoms (Purnamasari et al., 2021). This method is widely employed in the analysis of heavy metal content due to its high level of sensitivity and relatively simple process (Asra, Maisitoh, and Rusdi 2019). The Pb (II) content present in polluted water can be removed through the use of adsorption techniques. Adsorption is defined as the mechanism by which a molecule or ion is absorbed on the surface of an adsorbent (Zulfania et al., 2022). Adsorption occurs as a result of the attractive forces between molecules on the surface of the solid (adsorbent). As stated by Wijayanti et al.(2018), The adsorption process is influenced by a number of factors, including the adsorbent type, the surface area of the adsorbent, and the type and concentration of the adsorbed substance. Due to the addition of functional groups that facilitate interaction with metals, C-dots derived from fast-growing wood sawdust can be employed as an adsorbent. As posited the utilization of adsorbents with diminutive particle dimensions will result in a considerable expansion of the surface area, which will consequently impact the absorption capacity of C-dots in the process of adsorbing Pb (II) metal by (Widayatno et al., 2017). Furthermore, the C-dots formula, when combined with passivation agents, exhibits active functional groups on its surface in the form of carbonyl groups (C=O) and atoms with high electronegativity, such as nitrogen and oxygen atoms (Qi et al. 2023).
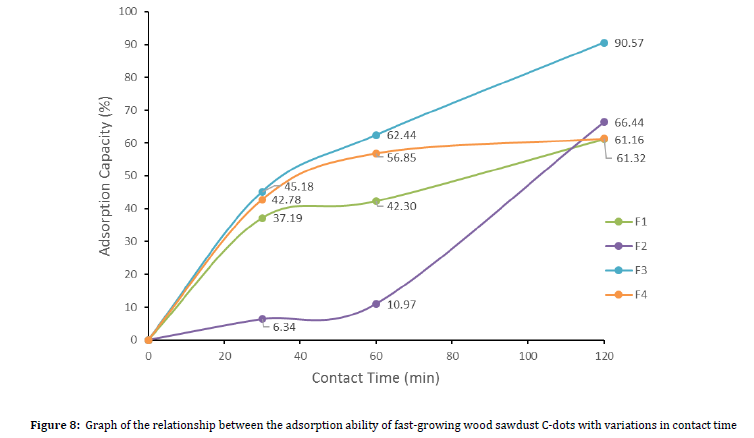
Figure 8 illustrates that the adsorption C-dots capacity increases with the duration of contact for all formulas. This indicates that C-dots can remain in an optimal state for extended periods, as the adsorption value continues to rise without reaching a saturation point for all formulas. The longer the contact time, the greater the duration of contact between the C-dots particles and the metal on the C-dots surface. This allows for sufficient contact time to be reached, which is necessary for maximal adsorption of Pb (II) metal (Irwandi, Yenti, and Chairul 2015). The maximum adsorption capacity of C-dots was observed to be 61.16%, 66.44%, 90.57%, and 61.32% for formulas (F1) Citric Acid-NH4OH, (F2) Citric Acid-Urea, (F3) Urea, and (F4) Water, respectively. The highest percentage of adsorption ability is observed in F3, which employs a urea passivation agent. This phenomenon can be attributed to the presence of carbonyl (C=O) and amine (NH₂) functional groups in the structural framework of urea compounds, which possess high electronegativity properties due to the presence of oxygen and nitrogen atoms. These properties facilitate the adsorption of positively charged metals (Hakimifar and Morsali, 2019). The interaction between urea and stable metals will enhance the capacity of Pb(II) metal sorption by C-dots.
The modification of the C-dot surface with specific functional groups enables the customization of its adsorption properties for specific metal ions. This can be achieved through the formation of covalent bonds, the establishment of electrostatic interactions, or the development of hydrogen bonds. The synthesis of C-dots with the addition of citric acid demonstrated that this method does not significantly influence the metal adsorption ability, as evidenced by the absence of maximum metal adsorption results. This phenomenon may be attributed to the excessive saturation of the C-dot surface with functional groups derived from the passivation agent, which impairs its ability to adsorb Pb metal optimally (Wu et al., 2022). Furthermore, in F4, the highest adsorption occurs due to the fact that the c-dot surface, which has not undergone passivation, does not reach saturation.
3.2.7 Testing the Adsorption of Dyes
A significant environmental concern is the discovery of numerous dyes, particularly in aquatic systems. Conversely, the utilisation of C-dots is becoming increasingly prevalent, with one notable application being in the environmental domain, where C-dots are employed as adsorbents. As stated methylene blue is among the cationic dyes that can be adsorbed by an adsorbent by (Nitsae et al., 2021). The objective of this test is to ascertain the capacity of C-dots to adsorb methylene blue (MB) via an adsorption mechanism. Adsorption offers a number of advantages, including efficiency, straightforward implementation, minimal energy demands, and the potential for utilizing a diverse array of adsorbent materials. The adsorption capacity of a substance is contingent upon the specific adsorbent employed (Liu et al., 2024). C-dots have been demonstrated to possess a relatively high capacity for the adsorption of diverse adsorbates, including dyes. Consequently, the use of C-dots for the purpose of dye removal from polluted water represents an efficient and viable alternative measure.
3.2.8 Effectiveness of Metal Pb Sorption in Ciliwung River Water
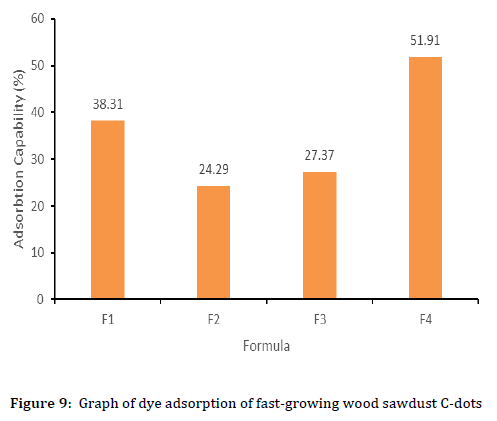
As illustrated in Figure 9, the C-dots synthesized without the incorporation of a passivation agent (F4) exhibited the highest adsorption capacity, reaching 51.91%. The solvent employed during the synthesis of C-dots influences the surface state of the resulting C-dots, which in turn determines the properties of the C-dots (Ding et al., 2018). This demonstrates that the synthesis of C-dots without the incorporation of passivating agents is more effective than the addition of passivating agents in adsorbing dyes on the surface of C-dots. As have observed, the capacity of C-dots to adsorb methylene blue is diminished when surface functional groups from passivation agents are introduced, resulting in a saturation of the C-dots surface (Piliang et al., 2022).
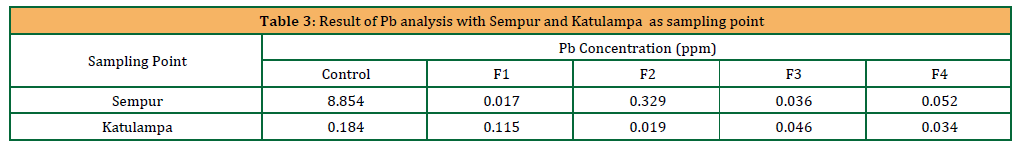
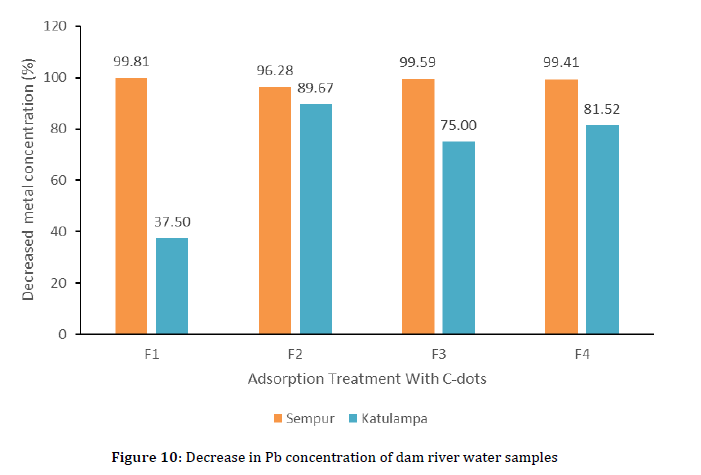
Carbon dots (C-Dots) have been demonstrated to be highly effective in the removal of metal ions from metal-polluted water sources, including river water and wastewater. The adsorption of metals on the surface of C-dots can be followed by doping, which allows the formation of metal-doped carbon dots (MCDs). These MCDs facilitate the detection and monitoring of metals in water samples, even with the assistance of UV radiation. The presence of heavy metals can be identified through the indication of different luminescent colors (Akhter et al. 2023). This renders C-dots highly valuable for their deployment in environmental and water treatment applications. The results of the analysis demonstrate the ability to quantify Pb metal in river water samples from the Sempur and Katulampa sampling points. The concentration of Pb metal was found to decrease following the adsorption treatment with c-dots in various synthesis formulations. The percentage decrease in Pb metal concentration (Figure 10) in river water samples at the Sempur sampling point is above 95%, indicating that c-dots in all formulations have excellent absorption properties and can effectively remove almost all Pb metal. Moreover, the reduction in Pb metal concentration in river water samples at the Katulampa sampling point exhibits the highest value of F2, at 89.67%, and the lowest in F1, at 37.50%. The disparity in the adsorbing capacity of each C-dot formulation can be attributed to the variation in the doping of functional groups or atoms on the C-dot surface (Perumal et al., 2022). The doping of carbonyl functional groups derived from citric acid and nitrogen atoms derived from urea and ammonium causes the adsorption process to occur through chemisorption reactions (Yahaya Pudza et al., 2020). These reactions take place between Pb ions and the surface functional groups of C-dots.
Based on Government Regulation (PP) Number 22 of 2021 Concerning the Implementation of Environmental Protection and Management, the maximum permissible level of Pb metal in river water is 0.03 ppm. The results of the adsorption treatment with C-dots in F1 and F3 (Table 1) demonstrate that the levels of Pb metal in river water samples from the sempur sampling points have reached the PP standards, namely 0.017 and 0.036 ppm. Furthermore, the Katulampa sampling point also complies with the PP standard in the F2 and F4 treatments, namely 0.019 and 0.034 ppm. These findings demonstrate that C-dots synthesized from wood sawdust are capable of effectively absorbing heavy metals from Ciliwung river water samples. This aligns with the assertion that C-dots possess the capacity to bind heavy metal ions in water, rendering them an optimal solution for removing pollutants such as lead, mercury, and cadmium from contaminated water sources by (Parambil and Rajamani, 2024).
5. CONCLUSION
The synthesis of C-dots based on fast-growing wood sawdust was successfully achieved through the application of a hydrothermal method. The synthesis was deemed a success based on the observation of fluorescence activity. The citric acid-NH₄OH (F1) C-dots exhibited the highest yield, with the addition of functional groups from passivation agents affecting the characteristics and yield. The characterization of the C-dots optical properties the in question yielded the result that they exhibited absorbance peaks in the ultraviolet region. The fluorescent spectrophotometer test of C-dots exhibits an emission wavelength in the visible region. The formation of C-dots is further corroborated by the FTIR test, which reveals the presence of active functional groups on the C-dots surface. The addition of a passivation agent had no effect on the dye sorption ability of C-dots. The synthesized C-dots demonstrated activity as a sensor and adsorbent of Pb²⁺ metal ions, exhibiting a change in color intensity and adsorption ability with an increase in contact time. The results of the tests conducted on samples of water from the Ciliwung River demonstrated that C-dots were effective in adsorbing Pb metal, with a discernible reduction in Pb metal concentrations observed at both the Katulampa and Sempur sampling points.
ACKNOWLEDGMENT
This study was funded by The Osaka Gas Foundation of International Cultural Exchange (OGFICE) Research Grant for 2023-2024:
REFERENCE
Akhter, F., Ahmed, J., Pinjaro, M. A., Shaikh, F. A., Arain, H. J., and Ahsan, M. J., 2023. Metal-Doped Carbon Dots (MCDs) as Efficient Nano-Adsorbents for Detection, Monitoring, and Degradation of Wastewater Pollutants: Recent Progress, Challenges, and Future Prospects.” Water, Air, and Soil Pollution 234(11): Pp. 672. doi: 10.1007/s11270-023-06699-6.
Anggraini, G.A., and Dwandaru, W.S.B., 2021. Sintesis Dan Karakterisasi Nanomaterial Carbon Dots Berbahan Dasar Daun Kemangi. 8(1): Pp. 36–42.
Asra, Ridho, Maisitoh Maisitoh, and Rusdi Rusdi. 2019. Analysis of Metal Contents Lead and Cadmium in Uretic Acid Jamu By Using Atomic Absorption Spectrophotometric. Journal of Pharmaceutical And Sciences 2(1): Pp. 10–16. doi: 10.36490/journal-jps.com.v2i1.11.
Asrini, Ni Ketut, I., Wayan Sandi Adnyana, and I. Nyoman Rai. 2017. Studi Analisis Kualitas Air. Ecotrophic : Jurnal Ilmu Lingkungan 11(2): PP. 101–7.
Ding, H., Wei, J. S., Zhang, P., Zhou, Z. Y., Gao, Q. Y., and Xiong, H. M., 2018. Solvent-Controlled Synthesis of Highly Luminescent Carbon Dots with a Wide Color Gamut and Narrowed Emission Peak Widths. Small 14(22):1–10. doi: 10.1002/smll.201800612.
Elina, R., and Rori, D. C., 2023). Karakterisasi FTIR Pada Karbon Aktif Terimpregnasi ZnO. Jurnal Pendidikan Tambusai 7(3): Pp. 23827–31.
Etefa, H. F., Tessema, A. A., and Dejene, F. B., 2024. Carbon Dots for Future Prospects: Synthesis, Characterizations and Recent Applications: A Review (2019–2023). C 10(3).
González-González, R. B., González, L. T., Madou, M., Leyva-Porras, C., Martinez-Chapa, S. O., and Mendoza, A., 2022. Synthesis, Purification, and Characterization of Carbon Dots from Non-Activated and Activated Pyrolytic Carbon Black.” Nanomaterials 12(3).
Government Regulation (PP) Number 22 of 2021 Concerning the Implementation of Environmental Protection and Management.
Hakimifar, Azar, and Ali Morsali. 2019. Urea-Based Metal–Organic Frameworks as High and Fast Adsorbent for Hg2+ and Pb2+ Removal from Water.” Inorganic Chemistry 58(1):180–87. doi: 10.1021/acs.inorgchem.8b02133.
Hamilton, G., and Sanabria, H., 2019. Multiparameter Fluorescence Spectroscopy of Single Molecules. Elsevier Inc.
Han, G., and Liu, X., 2024.Environmental Effects of Natural Processes and Human Activities on the Water Environment in Watershed. Water 16(20).
Irwandi, R., Silvia Reni, Y., and Chairul., 2015. Penentuan Massa Dan Waktu Kontak Optimum Adsorpsi Karbon Aktif Dari Ampas Tebu Sebagai Adsorben Logam Berat Pb.” Angewandte Chemie International Edition, 6(11), Pp. 951–952. 1(April):1–9.
Jaouadi, M., 2021. Characterization of Activated Carbon, Wood Sawdust and Their Application for Boron Adsorption from Water. International Wood Products Journal 12(1):22–33. doi: 10.1080/20426445.2020 .1785605.
Jiang, Z., Krysmann, M. J., Kelarakis, A., Koutnik, P., Anzenbacher, P., Roland, P. J., Sun, L., 2017. Understanding the Photoluminescence Mechanism of Carbon Dots.” MRS Advances 2(51):2927–34. doi: 10.1557/adv.2017.461.
Kasprzyk, W., Świergosz, T., Bednarz, S., Walas, K., Bashmakova, N. V., Bogdał, D., 2018. Luminescence Phenomena of Carbon Dots Derived from Citric Acid and Urea-a Molecular Insight. Nanoscale 10(29):13889–94. doi: 10.1039/c8nr03602k.
Kong, J., Wei, Y., Zhou, F., Shi, L., Zhao, S., Wan, M., and Zhang, X., 2024.Carbon Quantum Dots: Properties, Preparation, and Applications. Molecules 29(9).
Li, L., and Tao, D., 2018. Photoluminescence Tuning in Carbon Dots: Surface Passivation or/and Functionalization, Heteroatom Doping.” Journal of Materials Chemistry C 6(30): Pp. 7944–70. doi: 10.1039/c7tc05878k.
Li, P., and Li, S. F., 2020. Recent Advances in Fluorescence Probes Based on Carbon Dots for Sensing and Speciation of Heavy Metals. Nanophotonics 10(2): Pp. 877–908. doi: 10.1515/nanoph-2020-0507.
Lin, P. Y., Hsieh, C. W., Kung, M. L., Chu, L. Y., Huang, H. J., Chen, H. T., Hsieh, S., 2014.Eco-Friendly Synthesis of Shrimp Egg-Derived Carbon Dots for Fluorescent Bioimaging. Journal of Biotechnology 189:114–19. doi: 10.1016/j.jbiotec.2014.08.043.
Liu, Q., Gao, X., Liu, Z., Gai, L., Yue, Y., and Ma, H., 2023. Sensitive and Selective Electrochemical Detection of Lead(II) Based on Waste-Biomass-Derived Carbon Quantum Dots@Zeolitic Imidazolate Framework-8. Materials 16(9).
Liu, X., Niu, X., Tian, Y., Jiang, Y., Cheng, C., Wang, T., Xu, Y., 2024. Adsorption Behavior of Carbon Dots on La3+ and The Multiple Effects on The Growth of Mung Bean Seedlings under La3+ Stress. Environmental Science: Nano. doi: 10.1039/D4EN00530A.
Lubis, A.M., Angin, B.P., and Nasruddin, 2016. Studi Tentang Pengamatan Fluoresensi Berdasarkan Domain Panjang Gelombang Spektroskopi Fluoresensi Untuk Identifikasi Bahan. ISSN: 2442-7306. Jurnal Ilmu Pertanian 20(1): Pp. 303–7.
Meiling, T. T., Schürmann, R., Vogel, S., Ebel, K., Nicolas, C., Milosavljević, A. R., and Bald, I., 2018. Photophysics and Chemistry of Nitrogen-Doped Carbon Nanodots with High Photoluminescence Quantum Yield. Journal of Physical Chemistry C 122(18): Pp. 10217–30. doi: 10.1021/acs.jpcc.8b00748.
Mohammed, S. J., Omer, K. M., and Hawaiz, F. E., 2023. Deep Insights to Explain the Mechanism of Carbon Dot Formation at Various Reaction Times Using the Hydrothermal Technique: FT-IR, 13C-NMR, 1H-NMR, and UV-Visible Spectroscopic Approaches. RSC Advances 13(21):14340–49. doi: 10.1039/D3RA01646C.
Monday, Yakubu Newman, Jaafar Abdullah, Nor Azah Yusof, Suraya Abdul Rashid, and Rafidah Hanim Shueb. 2021. “Facile Hydrothermal and Solvothermal Synthesis and Characterization of Nitrogen-Doped Carbon Dots from Palm Kernel Shell Precursor.” Applied Sciences (Switzerland) 11(4):1–17. doi: 10.3390/app11041630.
Nallayagari, A. R., E. Sgreccia, R. Pizzoferrato, M. Cabibbo, S. Kaciulis, E. Bolli, L. Pasquini, P. Knauth, and M. L. Di Vona. 2022. “Tuneable Properties of Carbon Quantum Dots by Different Synthetic Methods.” Journal of Nanostructure in Chemistry 12(4):565–80. doi: 10.1007/s40097-021-00431-8.
Neikov, OD, and NA Yefimov. 2019. Handbook of Non-Ferrous Metal Powders. Amsterdam (NL): Elsevier.
Nitsae, M., Solle, H. R., Martinus, S. M., and Emola, I. J., 2021. Studi Adsorpsi Metilen Biru Menggunakan Arang Aktif Tempurung Lontar (Borassus Flabellifer L.) Asal Nusa Tenggara Timur. Jurnal Kimia Riset 6(1): Pp. 46–57.
Nuryadin, B. W., U. Qulsum, E. C. S., Mahen, A. Y., Nuryantini, H., Aliah, and Perkasa, Y. S., 2016. Synthesis and Optimization of Carbon Nanoparticles (C-Dots) As Absorber Materials for Solar Distillation Applications. Jurnal Pendidikan Fisika Indonesia 12(2): Pp. 137–41. doi: 10.15294/jpfi.v12i2.7518.
Olaiya, B. C., Lawan, M. M., and Olonade, K. A., 2023. Utilization of Sawdust Composites in Construction—a Review.” SN Applied Sciences 5(5):140. doi: 10.1007/s42452-023-05361-4.
Pandiyan, S., Arumugam, L., Srirengan, S. P., Pitchan, R., Sevugan, P., Kannan, K., and Gandhirajan, V., 2020. Biocompatible Carbon Quantum Dots Derived from Sugarcane Industrial Wastes for Effective Nonlinear Optical Behavior and Antimicrobial Activity Applications. ACS Omega 5(47): Pp. 30363–72. doi: 10.1021/acsomega.0c03290.
Parambil, A. M., and Rajamani, P., 2024. Carbon Dots: A Promising Path towards Environmental Sustainability.” Environ. Sci.: Adv. doi: 10.1039/D4VA00273C.
Perumal, S., Atchudan, R., Thirukumaran, P., Yoon, D. H., Lee, Y. R., and Cheong, I. W., 2022. Simultaneous Removal of Heavy Metal Ions Using Carbon Dots-Doped Hydrogel Particles. Chemosphere 286:131760. doi: https://doi.org/10.1016/j.chemosphere.2021.131760.
Piliang, A. F. R., Tarigan, K., Humaidi, S., Barus, D. A., and Gea, S., 2022.Nitrogen-Doped Carbon Dots From Bilimbi Juice (Averrhoa Bilimbi L.) Via Hydrothermal Method For Iron and Mercury Sensing.” Elkawnie 8(1):149. doi: 10.22373/ekw.v8i1.11813.
Prasasti, R. I., Jannah, R., Wati, A. N. B., Kusumandari, K., and Isnaeni, I., 2022. Synthesis of Carbon Dots Based on Corn Cobs as Heavy Metal Ion Sensors Using the Microwave Method. Journal of Physics: Theories and Applications 6(2):97. doi: 10.20961/jphystheor-appl.v6i2.59347.
Purnamasari, A.N.R., Mubarak, A.S., and Mulyono, 2021. Analisis Kadar Logam Berat Cadmium (Cd) Dengan Metode Atomic Abrsoption Spectrophotometry (AAS) Pada Produk Rajungan Kaleng Di Balai Pengujian Mutu Hasil Perikanan (BPMHP) Semarang, Jawa Tengah. Jurnal Ilmu Kelautan 10 (2): Pp. 93–98.
Putro, P. A., and Maddu, A., 2019. Sifat Optik Carbon Dots (C-Dots) Dari Daun Bambu Hasil Sintesis Hijau Berbantukan Gelombang Mikro.” Wahana Fisika 4(1):47. doi: 10.17509/wafi.v4i1.15569.
Qi, H., Qiu, L., Zhang, X., Yi, T., Jing, J., Sami, R., and Rahman, M. M., 2023. Novel N-Doped Carbon Dots Derived from Citric Acid and Urea: Fluorescent Sensing for Determination of Metronidazole and Cytotoxicity Studies.” RSC Advances 13(4): Pp. 2663–71. doi: 10.1039/D2RA07150A.
Qin, Y., Bai, Y., Huang, P., and Wu, F. Y., 2021. Dual Emission Carbon Dots for Ratiometric Fluorescent Water Sensing, Relative Humidity Sensing, and Anticounterfeiting Applications. Journal ACS Applied Nano Materials 4(10): Pp. 10674–81.
Abd Rani, U., Ng, L. Y., Ng, C. Y., Mahmoudi, E., 2020. A Review of Carbon Quantum Dots and Their Applications in Wastewater Treatment. Advances in Colloid and Interface Science 278:102124. doi: https://doi.org/10.1016/j.cis.2020.102124.
Raveendran, V., and Kizhakayil, R. N., 2021. Fluorescent Carbon Dots as Biosensor, Green Reductant, and Biomarker. ACS Omega 6(36): Pp. 23475–84. doi: 10.1021/acsomega.1c03481.
Raymond, J. O., DANJUMA, K., and OKOLI, B., 2023. Efficiency of Chemically Modified Activated Carbon Derived from Banana Peel for Removal of Pb2+ and Zn2+ from Aqueous Solution. Dutse Journal of Pure and Applied Sciences 9: Pp. 53–64. doi: 10.4314/dujopas.v9i1b.6.
Ren, J., Malfatti, L., and Innocenzi, P., 2020. Citric Acid Derived Carbon Dots, the Challenge of Understanding the Synthesis-Structure Relationship. C 7(1):2. doi: 10.3390/c7010002.
Sa’diyah, K., Suharti, P. H., Hendrawati, N., Pratamasari, F. A., and Rahayu, O. M., 2021. Pemanfaatan Serbuk Gergaji Kayu Sebagai Karbon Aktif Melalui Proses Pirolisis Dan Aktivasi Kimia. CHEESA: Chemical Engineering Research Articles 4(2):91. doi: 10.25273/cheesa.v4i2 .8589.91-99.
Seedad, R., Ratanawimarnwong, N., Jittangprasert, P., Mantim, T., and Songsrirote, K., 2021. “Carbon Dots Prepared from Citric Acid and Urea by Microwave-Assisted Irradiation as a Turn-on Fluorescent Probe for Allantoin Determination.” New Journal of Chemistry 45(47): Pp. 22424–31. doi: 10.1039/D1NJ03284D.
Sendao, R., de Yuso, M. D. V. M., Algarra, M., da Silva, J. C. E., and da Silva, L. P., 2020. Comparative Life Cycle Assessment of Bottom-up Synthesis Routes for Carbon Dots Derived from Citric Acid and Urea.” Journal of Cleaner Production 254: Pp. 1–10. doi: 10.1016/j.jclepro.2020 .120080.
Shen, P., Gao, J., Cong, J., Liu, Z., Li, C., and Yao, J., 2016. Synthesis of Cellulose-Based Carbon Dots for Bioimaging. ChemistrySelect 1(7):1314–17. doi: 10.1002/slct.201600216.
Shiddiq, M., and Umami, R., 2016. Analysis of Relation Between Fluorescence Intensity and Ripeness Levels of Loosed Palm Oil Fruits. Jurnal Penelitian Sains 18(2):168331.
da Silva Souza, D. R., Caminhas, L. D., de Mesquita, J. P., and Pereira, F. V., 2018. Luminescent Carbon Dots Obtained from Cellulose. Materials Chemistry and Physics 203: Pp. 148–55. doi: 10.1016/j.matchemphys.2017.10.001.SNI 6989.59:2008, which pertains to Water and Wastewater—Part 59: Wastewater Sampling Method.
Sugiarti, S., And Darmawan, N., 2015. Synthesis of Fluorescence Carbon Nanoparticles from Ascorbic Acid.” Indonesian Journal of Chemistry 15(2): Pp. 141–45. doi: 10.22146/ijc.21207.
Sugito, S., and Setiawan, A. K. R., 2022. Uji Performa AAS Thermo Ice 3000 Terhadap Logam Cu Menggunakan CRM 500 Dan CRM 697 Di UPT Laboratorium Terpadu UNS. Jurnal Pengelolaan Laboratorium Pendidikan 4(1):1–6. doi: 10.14710/jplp.4.1.1-6.
Sun, X., and Lei, Y., 2017. Fluorescent Carbon Dots and Their Sensing Applications. TrAC – Trends in Analytical Chemistry 89: Pp. 163–80. doi: 10.1016/j.trac.2017.02.001.
Suparjo, M.N., 2009. Kondisi Pencemaran Perairan Sungai Babon Semarang.” Jurnal Saintek Perikanan 4(2): Pp. 38–45.
Wang, Y., and Hu, A., 2014. Carbon Quantum Dots: Synthesis, Properties and Applications.” Journal of Materials Chemistry C 2(34): Pp. 6921–39. doi: 10.1039/C4TC00988F.
Widayatno, Tri, Teti Yuliawati, Agung Adi Susilo, Program Studi, Teknik Kimia, Fakultas Teknik, and Universitas Muhammadiyah. 2017. “Adsorpsi Logam Berat (Pb) Dari Limbah Cair Dengan Adsorben Arang Bambu Aktif.” Jurnal Teknologi Bahan Alam 1(1): Pp. 17–23.
Wijayanti, A., Susatyo, E. B., Sukarjo, S., and Kurniawan, C., 2018. Adsorpsi Logam Cr(VI) Dan Cu(II) Pada Tanah Dan Pengaruh Penambahan Pupuk Organik.” Indonesian Journal of Chemical Science 7(3): Pp. 242–48.
Wu, J., Lu, Q., Wang, H., and Huang, B., 2022. Passivator-Free Microwave–Hydrothermal Synthesis of High Quantum Yield Carbon Dots for All-Carbon Fluorescent Nanocomposite Films. Nanomaterials 12(15).
Yahaya Pudza, M., Zainal Abidin, Z., Abdul Rashid, S., Md Yasin, F., Noor, A. S. M., and Issa, M. A., 2020. Eco-Friendly Sustainable Fluorescent Carbon Dots for the Adsorption of Heavy Metal Ions in Aqueous Environment. Nanomaterials (Basel, Switzerland) 10(2). doi: 10.3390/nano10020315.
Yan, F., Jiang, Y., Sun, X., Bai, Z., Zhang, Y., Zhou, X., 2018. Surface Modification and Chemical Functionalization of Carbon Dots: A Review. Microchimica Acta 185(9):424. doi: 10.1007/s00604-018-2953-9.
Yoo, D., Park, Y., Cheon, B., and Park, M. H., 2019. Carbon Dots as an Effective Fluorescent Sensing Platform for Metal Ion Detection. Nanoscale Research Letters 14(1):272. doi: 10.1186/s11671-019-3088-6.
Zhang, D., Liu, L., and Li, C., 2023. Carbon Dots with High Quantum Yields Used for Fe3+ Detection, Information Encryption and Anti-Counterfeiting.” New Journal of Chemistry 47(43):20061–69. doi: 10.1039/D3NJ03499B.
Zhao, D., Liu, X., Wei, C., Qu, Y., Xiao, X., and Cheng, H., 2019. One-Step Synthesis of Red-Emitting Carbon Dots via a Solvothermal Method and Its Application in the Detection of Methylene Blue. RSC Advances 9(51): Pp. 29533–40. doi: 10.1039/C9RA05570C.
Zou, L., Gu, Z., and Sun, M., 2015. Review of the Application of Quantum Dots in the Heavy-Metal Detection. Toxicological and Environmental Chemistry 97(3–4): Pp. 477–90. doi: 10.1080/02772248.2015.105 0201.
Zulfania, F., and Nur, A. M., 2022. Kemampuan Adsorpsi Logam Berat Zn Dengan Menggunakan Adsorben Kulit Jagung (Zea Mays).” Jurnal Chemurgy 6(2): Pp. 65–69.
| Pages | 72-80 |
| Year | 2025 |
| Issue | 1 |
| Volume | 9 |
