
IMPACT ON WELL WATER QUALITY DUE TO SEA WATER INTRUSION AND ANTHROPOGENIC ACTIVITIES IN OLUVIL, SRI LANKA
Journal: Water Conservation and Management (WCM)
Author: R.A. Nileesha Malshani Ranasinghe, M.G.M. Thariq, Hassan Ammouneh, M.M. Mohamed Najim and Ahmed Jalal Khan Chowdhury
Print ISSN : 2523-5664
Online ISSN : 2523-5672
This is an open access article distributed under the Creative Commons Attribution License CC BY 4.0, which permits unrestricted use, distribution, and reproduction in any medium, provided the original work is properly cited
Doi: 10.26480/wcm.01.2025.86.92
Abstract
 Groundwater wells are vital for meeting the daily water needs of rural and coastal areas, particularly in Oluvil village, Sri Lanka. The extraction of groundwater from shallow aquifers, mainly through dug wells along the east coastal sands, has raised concerns about challenges such as seawater intrusion and anthropogenic activities that can impact water quality. This research addresses the gap in understanding well water quality in Oluvil by conducting a comprehensive study encompassing physical, chemical, and biological parameters. Utilizing a combination of quantitative and qualitative methods, the study established fifteen sampling stations at varying distances from the sea (<100m, 100 – 300m, 300 – 500m). A questionnaire survey was conducted to gather demographic and area-related data. The findings revealed diverse water qualities associated with the distance from the Oluvil Sea. Wells located at a 300 – 500m distance exhibited slightly elevated levels in mean temperature (27.4⁰C), mean pH (7.35), mean electrical conductivity (0.45 ms/cm), mean total dissolved solids (213.07 mg/L), mean hardness (197.67 mg/L) and mean alkalinity (196.33 mg/L). A higher salinity level (0.21 PSU) was recorded within the 300 – 500m distance compared to <100m and 100 – 300m. E. coli and total coliform bacteria were recorded in most of the wells making those waters unsuitable for human consumption. The well water in Oluvil is not suitable as a potable water source. Long-term use of saline well water for irrigation may cause salt deposition in agricultural lands. These results emphasize the need for effective water management practices to ensure the well-being of public health, agriculture, and the environment in the Oluvil region.
Keywords
Fecal contamination, Potable water, Public health, Salinity, Shallow groundwater
1. INTRODUCTION
Many families in rural areas depend on groundwater wells to fulfil their daily water requirements. Coastal communities in many regions in the world also use groundwater sources for many of their day-to-day activities, including drinking and cooking. In Sri Lanka many of the rural and coastal communities who are not supplied with treated drinking water supplies also depend on groundwater wells for their daily water needs (Ravindiran et al., 2023). According to Dissanayake & Chandrajith (2018), there is a shallow aquifer on the east coastal sands of Sri Lanka. The rural communities of the coastal areas mostly depend on the extraction of groundwater from this aquifer through dug wells for a long time (Samaraweera et al., 2016). According to the 2021 census report, many Sri Lankan families in rural areas solely depend on such wells to fulfil their daily water needs. Therefore, aquifers must contain water of acceptable quality to make it suitable enough to use as potable water. Sea water intrusion close to coastal zones and anthropogenic activities represent two of the main causes of groundwater pollution making the water unsuitable both for drinking and irrigation use (Jayathunga et al., 2020; Wang et al., 2021).
Groundwater quality varies widely based on the source and is based on physical properties such as colour, odour, turbidity, and chemical constituents such as major cations and anions (Kanagaraj et al., 2018). Biological properties of groundwater are a major concern when dealing with human health. In Sri Lanka, groundwater resources are widely used for domestic, commercial, and industrial purposes, small-scale irrigation, water supply schemes, and other purposes (Indika et al., 2022; Panabokke and Perera, 2005). Coastal aquifers in many parts of the world also contribute to fulfilling the water demands of coastal communities but in many cases, these aquifers face challenges of contamination (Hussain et al., 2019).
Coastal aquifers are an important source of water supply for drinking and agriculture, especially in arid and semi-arid regions (Muzzillo et al., 2021; Zamani et al., 2022). Therefore, it is crucial to maintain an acceptable level of water quality in those aquifers. The effect of human impact on groundwater quality is the most observable in the coastal sand aquifer in Sri Lanka (Panabokke and Perera, 2005; Reddy et al., 2015). The quality of groundwater can be affected by anthropogenic activities and by faecal pollution sources from humans and animals (Abanyie et al., 2023; Luque-Espinar and Chica-Olmo, 2020). Excessive use of chemical pesticides, the addition of industrial waste, and domestic and agricultural waste to the water bodies cause the deterioration of groundwater quality (Hossain et al., 2022). The general lack of sanitation, waste treatment, and drainage facilities in high-population areas of developing countries is also responsible for this (Abanyie et al., 2023; Peters and Meybeck, 2000). These anthropogenic influences cause elevated concentrations of heavy metals, mercury, coliforms, and nutrient loads in the well water (Abanyie et al., 2023; Khatri and Tyagi, 2015) .
People in Oluvil village in the Eastern coast of Sri Lanka primarily used well water as their potable water source. During the rainy season, well water tends to get contaminated. Due to overpopulation in some localities, there are lavatory pits established close to the water wells. Hence,overpopulation and heavy rains cause contamination of the shallowaquifers in Oluvil area. Many households do not practice water filtrationmethods or boiling of well water before consumption. Consumption oflow-quality water can cause various diseases among humans. However,there was no proper study conducted to estimate the well water quality inOluvil village. Evaluation of the impacts on well water quality due toseawater intrusion and human activities in Oluvil village is important.Hence, a study was conducted to assess the status of water quality of thewells and tube wells through qualitative analysis where selected physical,chemical, and biological water quality parameters of well water from asample of selected wells were analysed. Furthermore, the level of impactdue to seawater intrusion and anthropogenic activities on the quality ofwell water were also analysed.
2. MATERIALS AND METHODS
2.1 Study Area
This study deals with Oluvil, a rural coastal village in Ampara District inthe Eastern Province, Sri Lanka (Figure 1). In Oluvil village, 386 familiesdepend on manmade protected groundwater wells to fulfil their day-todaywater needs. The number of families using unprotected wells and tubewells is 45 and 127, respectively. However, in recent years, the watersupply from the National Water Supply and Drainage Board (NWSDB) ismore famous among the villagers. A total of 2,306 families in the Oluvil 01to Oluvil 07 GN divisions depend on pipe-borne water (GN Division Office– Oluvil, 2021).
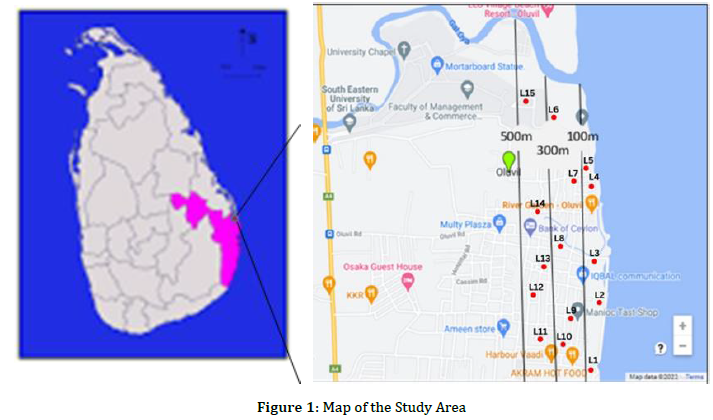
2.2 Well water sampling and data collection
The study area was divided into three strips where the first strip is 100minland from the coastline, the second is 100m – 300m from coastline andthe third is 300m – 500m from the coastline (Figure 1). Five (05) samplinglocations were selected from each strip (<100m, 100 – 300m, 300 – 500m)and altogether there were fifteen (15) sampling stations. On day one, awater sample of 750ml was collected from each sampling site from eachstrip. Three separate composite water samples were prepared by mixingthe collected water samples from each strip. Out of those compositesamples, three sub samples were taken to analyse the water qualityparameters. Water samples were taken once a week following the sameprocedure. Altogether, the study had five sampling events. Ultimatelyforty-five (45) water samples were taken for analysis. Water samples werecollected at a depth of around 30 cm from covered and uncovered waterwells.
Disinfected plastic water bottles, sterilized glass bottles, and BOD bottleswere used as sampling bottles. Water samples were filled into labelledsampling bottles and rinsed with water from the water body beforesampling. After collecting water samples, sampling bottles were closedtightly, preserved in an icebox, and immediately transferred to thelaboratory for analysis. The water samples were stored in a refrigeratorbetween -1⁰C to 4 ⁰C during preservation. The level of water quality in wellwater was assessed for different physical, chemical, and biologicalparameters.
2.3 Questionnaire Survey
Ethics Review Committee (ERC) approval for the study was obtained(ERC/FT/2022/03) from ERC of the faculty of technology of the SouthEastern University of Sri Lanka. A pilot questionnaire survey wasconducted among 06 households. Accordingly, the questionnaire wasmodified and a survey was conducted among 50 households who are livingnear Oluvil coastal line who owned water wells. Important data related tothe duration of using well water, depth of the water wells, uses of wellwater, awareness on water well pollution, water quality related problems,non-use of water well, measures taken to protect the well, distance fromlavatory pit to water well, and distance from sea to the water well wascollected. In addition, the data on population, labour force, number offamilies that have access to drinking water (water supply), land usepattern, and toilet facilities was gathered from the Divisional Secretariat(DS) office and the Ministry of Health (MOH) office, Addalaichenai.
2.4 Data Analysis And Interpretation
The qualitative data collected from the questionnaire survey was analysedusing MS Excel (2016) and quantitative data was analysed using IBM SPSSStatistics 26 software. The Spearman correlation was used to test thecorrelation between each water quality parameter. The water qualityparameters investigated were compared with Sri Lanka StandardInstitution (SLS) Water Quality Standards. The One-way ANOVA was usedto compare the differences in well water quality at <100m, 100 – 300m and300 – 500m distance from the study locations.
3. RESULTS AND DISCUSSION
3.1 Socioeconomic And Water Well
CharacteristicsSocioeconomic or sociodemographic factors may influence the well waterand water well status. The researchers found that socio-demographicfactors influenced the quality of household drinking water quality(Ondieki et al., 2022). Table 1 summarizes the socioeconomiccharacteristics and the status of water wells in the study location.
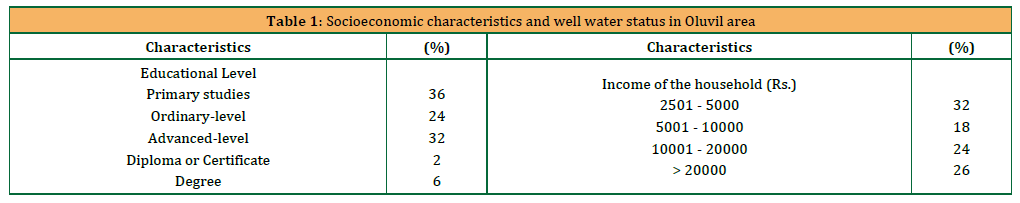
According to the results (Table 1), 32% of the respondents completed only primary education whereas only 6% had degree level education. The level of education plays crucial role in protecting the drinking water quality (Benameur et al., 2022; Seelen et al., 2019). There has been a decreasing trend of establishing water wells in the area for the past 20 years, the most agreeable reason is the poor quality of well water, one of the contributing factors for which could be the poor education level of the significant portion of the respondents in Oluvil area. The study reported that bad water quality has discouraged people to opt for groundwater in addition to lack of water supply (Janakarajan and Moench, 2018).
To have better access to good quality drinking water, people should have a stable and acceptable amount of income (Muzzillo et al., 2021). Half of the people from the study area had a monthly income level only up to Rs. 10,000, which is not enough even to fulfil their basic needs and another 24% had monthly income from Rs. 10,000.00 to 20,000.00. There were 26% of families who earned more than Rs. 20,000 as their monthly income (Table 1). The income level of the people have an impact on the status of the water wells.
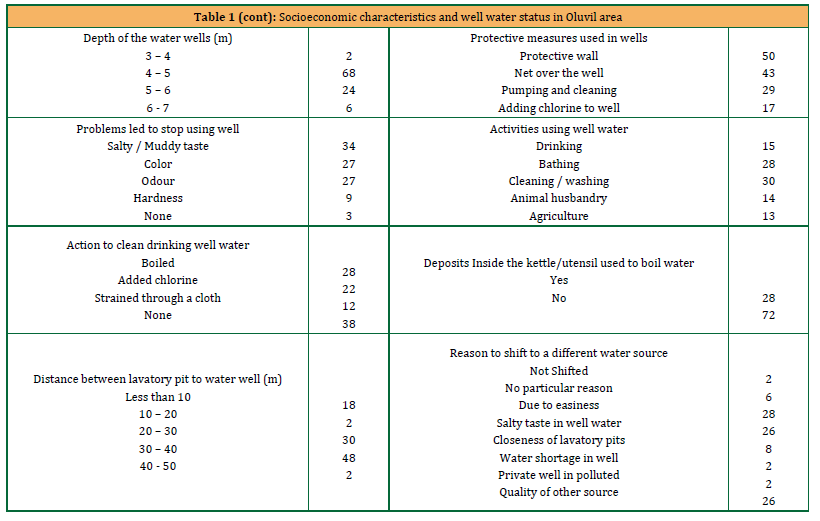
This a research have stated that the low-income level is one of the many reasons for less enthusiasm to act toward cleaning drinking water sources according to standard methods (Muzzillo et al., 2021). When considering the nature of water wells in the study area, 68% were dug up to 4m to 5m in depth until finding groundwater due to a shallow aquifer in the Ampara District (Kanda et al., 2017; Samaraweera et al., 2016). There were only 30% of households that have water wells with more than 5m depth.
In addition to that, there were 2% of water wells dug up to 3m to 4m depth.
According to the study results, drinking, bathing, cleaning, animal husbandry, and agriculture are the main activities that are carried out with well water in the study area. Almost all the households were using well water to fulfil the water needs of more than one activity. Oluvil water wells are mainly used for cleaning, washing, and bathing (Kanda et al., 2017). However, only 15% of the respondents from the study were using well water as their potable water source because many tend to use water from NWSDB to fulfil drinking and cooking needs. Animal husbandry and agriculture were not the most prominent sources of income among villagers in Oluvil. However, 14% and 13% of households were using well water for animal husbandry and agriculture, respectively. However, people who own a water well frequently use it, almost every day to fulfil at least one of their water requirements. Around 42% of the houses were using their private water wells more than 10 times per day. Other families used their water wells less than 10 times per day. Even though most of the subjected water wells were functioning daily, 92% of respondents declared that they were experiencing various water quality related problems in their wells. However, only 56% of the people acknowledged that their wells are polluted. Most of the water quality problems were related to salty or muddy taste (34% of water wells) and bad smell from well water (27% of water wells). Colour changes were observed in 27% of the wells. The brownish colour was most prominent in some of the water wells. Nine percent of water wells had been exposed to hardness problems. However, only 3% of the water well owners stated that there is no water quality-related problems in their wells in the recent years. Furthermore, most of the water wells experienced at least two of the problems identified in the recent years. 78% of the households had not stopped using their water wells even though they had experienced quality problems. This study data reported that reported that many water wells were abandoned due to water quality deterioration in the Philippines (Fujita et al., 1990). However, 22% of respondents had declared that they abandoned their water wells in recent years.
People in the study area are vigilant enough to establish basic protective measures to clean their drinking water. All the wells were protected with a cement wall and many households followed more than one method to protect their water wells and to clean drinking water. A total of 43 wells were covered with nets. Twenty-nine families were cleaning their wells by pumping out all the water (when it is necessary) and another 17 were adding chlorine to disinfect water. Another 15 households were adhering to boiling, chlorinating, and straining well water before using it as potable water. Accordingly, the households were cleaning their potable water to a certain extent. This analysis reported that hydraulic well restoration is used in cleaning water wells (Karwautz and Lueders, 2014). This Analysis reported that chlorine spot treatments were used to treat flooded tube wells in Bangladesh (Luby et al., 2006). According to the responses gathered in this study, 28% of the households who engaged in the practice of boiling water before consumption reported on the presence of deposits inside the kettle used for boiling. The formation of deposits in water kettles may be influenced by various solids or hardness in well water(Al-Gailani et al., 2020).
Oluvil is a populated area that has houses established close to each other. The study has shown that there is adequate distance between their lavatory pit to the water well. But 2% of lavatory pits were too close to the water wells (less 21 out of 50 lavatory pits had 5m to 6m of depth, another 15 had 4m to 5mof depth, 9 pits with 6m to 7m depth while the remaining 5 were shallowerthan 4m. In addition to the distance, the type of the lavatory pits also playsan important role in the groundwater pollution.According to the survey results, NWSDB water is a convenient source foreasy accessibility, readily available for consumption, and good qualitycompared to raw well water. Therefore, 28% of respondents had shiftedto NWSDB water from well water due to easiness, 26% due to the saltytaste of the well water, and another 26% for its overall good quality. Eightpercent of the people had decided to move to NWSDB water due to theimpact from nearby lavatory pits. According to the knowledge of 52% ofrespondents, the main cause of freshwater pollution in Oluvil village wasseawater intrusion. Increasing population and urbanization were alsoidentified by them as causes of water pollution.
3.2 Correlation Between Parameters
3.2.1 Changes In The Water Quality Parameters At Varying DistancesFrom The Sea
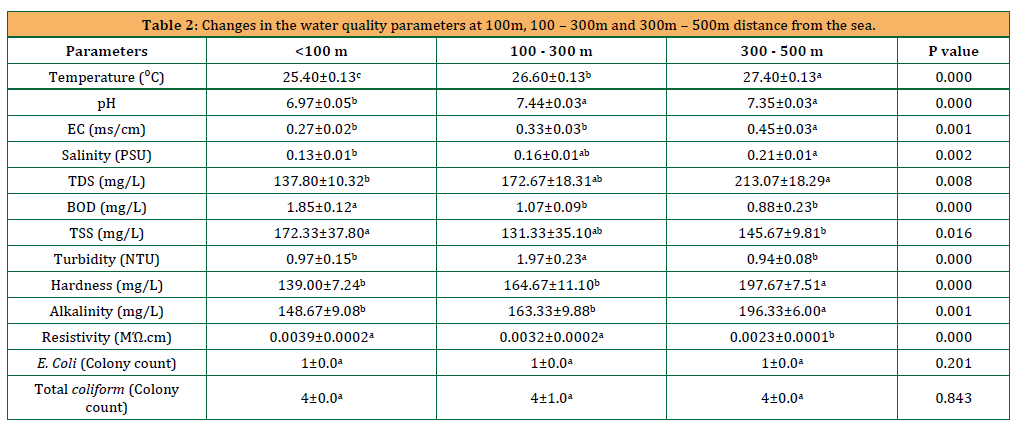
The survey results show that 68% of the water wells were situated lessthan 300m distance from the Sea. Other 32% of the water wells that weresubjected to the study were situated more than 400m away from the sea.Distance from the sea to the water well may have impacted the waterquality status of the well, especially related to pH, salinity, and hardness(Perera et al., 2018). According to Table 2, tested well water qualityparameters showed a diverse pattern with the distance from the sea. Atthe 300 – 500m distance, higher values were observed in temperature, EC,salinity, TDS, and BOD levels compared to <100m and 100 – 300mdistances. Hardness and alkalinity are also quite higher in the wells at 300- 500m distance compared to the wells from other two distances whichwere 197.67 mg/L, and 196.33 mg/L, respectively. The notable resultswere shown in salinity levels in well water. In <100m water wells, meansalinity was 0.13 PSU while in 100 – 300m and 300 – 500m, it was 0.16 PSU,and 0.21 PSU, respectively. The salinity level had risen with the distance than 20m distance). The distance between the lavatory pit and to water well has an impact on the water quality of the wells, especially during the rainy season and when the pits are filled to the overflow level (Islam et al., 2016). Based on the survey, it was found that from the sea. The main reason for this special condition may be the inlandwater bodies situated closer to water wells at the 300 – 500m distance..According to (Cañedo-Argüelles et al., 2013), secondary salination ininland water bodies can occur due to anthropogenic activities, irrigationand the rising of groundwater table especially in the arid and semi-aridregions. Those water bodies may be related to the water wells influencingsalinity in water (Cañedo-Argüelles et al., 2013). The mean TDS in 300 -500m was 213.07 mg/L, which was quite higher than the wells located atother distances. The reason may be due to higher anthropogenic activitiesand industrial works that release water-dissolvable solids into theenvironment. Ultimately, those ions and minerals dissolved ingroundwater cause higher dissolved solids in water wells compared to lesspopulated areas near coastal lines (Shoukat et al., 2020). The mean BODshowed a higher level in 300 – 500m strip which was 1.88 mg/L. A higherBOD level means higher demand for oxygen in water bodies. It is anindicator of increased biological activities which is demanding oxygen forvarious metabolic reactions. Because of human and animal faecalmaterials, household waste, and industrial waste which are prominentinside the country compared to the coastal line may lead to higher BODwithin a 500m perimeter (Abdullahi et al., 2021).
Furthermore, <100m distance from the sea shows better water qualitycompared to 100 – 300m and 300 – 500m distances. Exhilaratedanthropogenic and industrial activities happening inside the country havea large impact on well water quality compared to less urbanized coastalareas. Therefore, anthropogenic activities may have a higher impact onwell water quality than the impact on the sea due to seawater intrusion(Abdelfattah et al., 2023). However, the most pressing problem in alldistances was the presence of Coliform bacteria in well water. E. coli andtotal Coliform bacteria were recorded in most of the wells in Oluvil areamaking those waters unsuitable for human consumption. Seriousdisinfection is needed before using these well waters as potable water(Kothari et al., 2021; Some et al., 2021).
3.2.2 Correlation Of Physical And Chemical Parameters
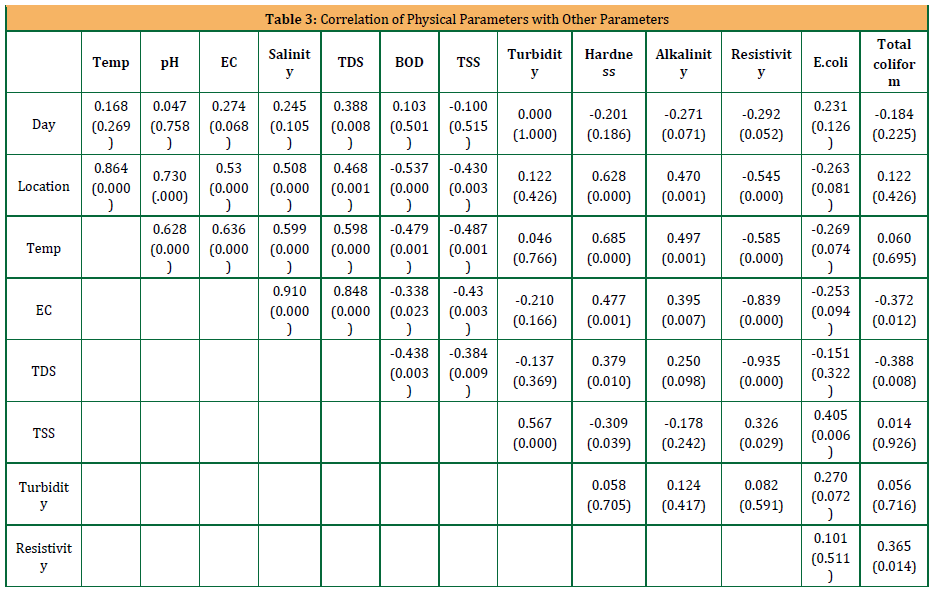
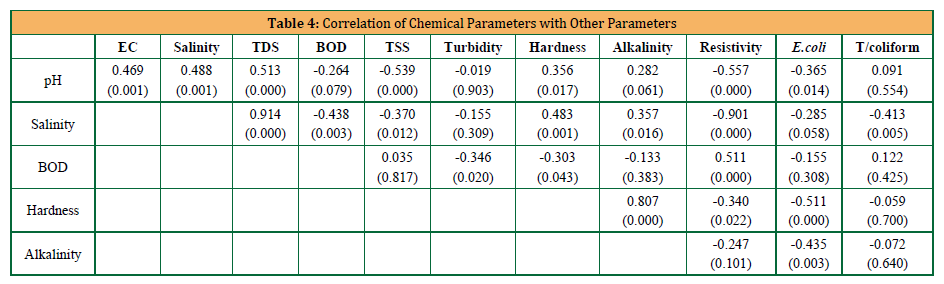
Table 3 shows the correlation between each tested physical water qualityparameter and Table 4 shows the correlation between each testedchemical water quality parameters. The Spearman Correlation was usedto analyse these data due to non-normality in the data set. According to thetested correlation with day and location against each parameter, TDS hasa weak significant correlation with time variation. Other parameters donot have a significant correlation with time. Temperature, pH, EC, salinity,TDS, hardness, and alkalinity were showing significantly positivecorrelation with location but BOD, TSS, resistivity, and E. coli count have anegative correlation.
When the correlation between each parameter is considered, thetemperature had a positive correlation with pH, EC, salinity, TDS,hardness, and alkalinity, and a negative correlation with BOD, TSS, andresistivity. There was a positive correlation between pH and EC, salinity,TDS, and hardness and a negative correlation with pH between TSS,resistivity, and E. coli count. Electrical conductivity is an importantparameter in water. According to the results, EC had a strong positive andsignificant correlation with salinity and TDS, a moderately positivecorrelation with hardness, and a weak correlation with alkalinity. Also,there was a negative correlation with BOD, TSS, resistivity, and totalColiform count. Furthermore, salinity had a positive significant correlationwith TDS, hardness, and alkalinity while a negative correlation with BOD,TSS, resistivity, and total Coliform count. BOD, resistivity, TSS, and totalcoliform count show a negative significant correlation with TDS but apositive correlation with hardness. BOD had a moderately positiverelationship with resistivity but a negative relationship with turbidity andhardness. TSS shows a positive correlation with turbidity, resistivity, andE. coli but a negative correlation with hardness. Hardness shows a positivecorrelation with alkalinity and a negative correlation with resistivity andE. coli. Resistivity had a positive but weak correlation with the total coliform count. Furthermore, the correlation between the physical, chemical, and biological qualities of well water needs to be considered before taking action to control critical parameters such as salinity, pH, turbidity, and faecal bacteria population. Changes that happen in one water quality parameter have a direct impact on the concentration of several other parameters (Kothari et al., 2021).
3.3 Comparison between tested well water quality and SLS standards
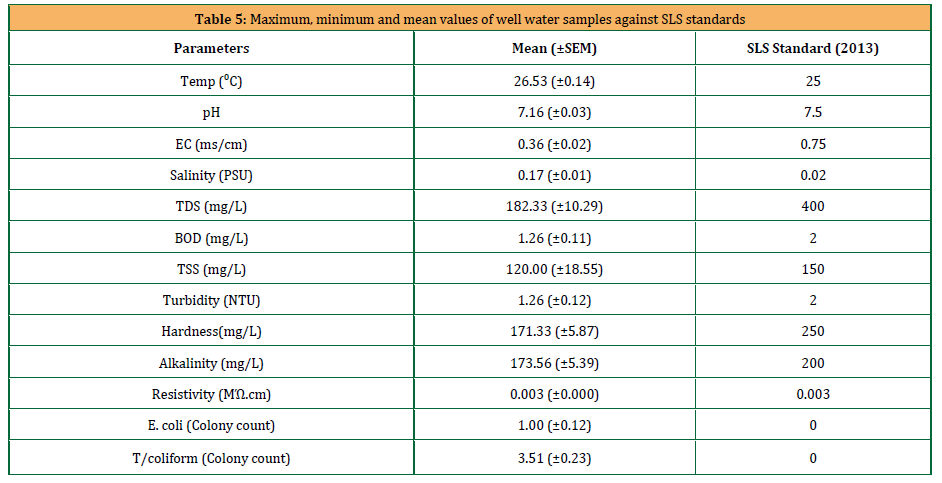
Table 5 shows the comparison between the physical, chemical, and biological properties of tested well water samples and drinking water quality standards based on Sri Lanka Standards 2013. According to these results, the mean salinity of all three strips was 0.17 (±0.01) PSU, which was much higher than the acceptable level (0.02 PSU). These results were also proven by the statements given by the residents from Oluvil village regarding the salty taste in their well water. Furthermore, the presence of E. coli and total coliform bacteria colonies were recorded as 1.00 (±0.12) and 3.51 (±0.23), respectively. Bacterial contamination negatively impacts well water quality and the health of the consumers because the presence of even one faecal bacterium in water makes it unhygienic to use as potable water. This contaminated water can cause serious health impacts such as diarrhoea, fever, and vomiting (Some et al., 2021). Children and elderly people were most at risk as elicited through the questionnaire survey.
The mean temperature also differs compared to SLS standards. According to the results given in table 1, the temperature was showing a rising pattern in the wells located more inland from the sea. Higher temperature of water can impact several other water quality parameters such as pH, TDS, and electrical conductivity by increasing chemical and biological reactions. The mean TDS was around 182.33 (±10.29) mg/L which was a positive sign for water quality when compared with SLS standards (400 mg/L). TSS and turbidity were also at acceptable levels in tested well water samples. The overall mean values of hardness and alkalinity were around 171.33 (±5.87) mg/L and 173.56 (±5.39) mg/L, respectively. There are several cases recorded around the country regarding serious health failures that occurred due to the consumption of hard or alkaline water (Gobalarajah et al., 2020). However, according to these results, it can be assured that well water in Oluvil is free from unacceptable levels of hardness and alkalinity. Even though all the other parameters are complying with SLS standards, the higher salinity level and the presence of bacterial colonies make the well water in Oluvil unsuitable for human consumption. By considering these outcomes of the tested well water samples, Oluvil water wells can be categorized as unsuitable for human consumption.
4.CONCLUSION
The water quality across the studied water wells in GN divisions Oluvil 01 to Oluvil 07 was not consistent. Diverse water qualities were recognized with the distance from the Sea. In particular, temperature, pH, electrical conductivity, total dissolved solids, hardness, and alkalinity increased with the distance from the sea. Therefore, water wells situated at 300 – 500m distance from the sea had a mean temperature of 27.4⁰C, mean pH of 7.35, mean electrical conductivity of 0.45 ms/cm, mean total dissolved solids of 213.07 mg/L, mean hardness of 197.67 mg/L and mean alkalinity of 196.33 mg/L. The values of those water quality parameters were lesser in the strips of <100m and 100 – 300m. Anthropogenic activities directly or indirectly influenced the well water quality inside the country than near the coastal line. Higher salinity level is (0.21 PSU) recorded within 300 – 500m strip. In addition to seawater intrusion, inland water bodies may have impacted on salinity level of water wells within a 500m distance.
Furthermore, both positive and negative but significant correlations were observed among tested water quality parameters. Therefore, when seawater intrusion and/or anthropogenic activities influence one parameter, it may tend to indirectly increase or decrease correlated parameters. Variations observed were mainly due to the influences from the Sea and anthropogenic activities including waste disposal, lavatory pits, and actions undertaken to protect water wells, etc. Even though the water quality varied in the study area, the majority of parameters were found to be within the standard limits specified by SLS 614: 2013 and FAO. However, salinity and faecal bacteria counts were much higher than the acceptable level. Therefore, well water in Oluvil is not suitable as potable water. Long-term use of saline well water for irrigation may cause salt deposition in agricultural lands. Also, there may be a risk of production drops in milking cattle and goats due to feeding of saline water.
Water from Oluvil water wells can be directly used for cleaning, washing, and other domestic purposes but not for drinking and cooking. Water from wells within <100m strip had better water quality compared to wells from 100 – 300m and 300 – 500m strips. Serious desalinization and disinfection processes are needed before using water for agricultural, aquatic life, livestock, and potable purposes.
Figure 4 illustrates the effect of temperature on the osmotic pressure of brackish and seawater. In Figure 4. a, as the Ts increases, the osmotic pressure of brackish water changes in steps across the temperature range. In contrast, figure 4b shows that the osmotic pressure of seawater increases linearly with temperature. Furthermore, figure 5 depicts the decrease in SEC for brackish water and seawater, reaching a minimum at 45°C. Additionally, figure 5. a show that the SEC for brackish water is lower than that for seawater, as presented in figure 5. b. The introduction of an ERD, as illustrated in figure 6, results in a continuous decrease in energy consumption across the entire temperature range for both brackish and seawater, reaching 0.57 kWh/m3 (figure 6. a) and 1.97 kWh/m3 (figure 6. b), respectively.
REFERENCES
Abanyie, S. K., Apea, O. B., Abagale, S. A., Amuah, E. E. Y., and Sunkari, E. D., 2023. Sources and factors influencing groundwater quality and associated health implications: A review. Eme rging Contaminants, 9(2), 100207. http s://doi.org/10.1016/j.emcon.2023.100207
Abdelfattah, M., Abdel-Aziz Abu-Bakr, H., Aretouyap, Z., Sheta, M. H., Hassan, T. M., Geriesh, M. H., Shaheen, S. E.-D., Alogayell, H. M., M. EL-Bana, E. M., and Gaber, A., 2023. Mapping the impacts of the anthropogenic activities and seawater intrusion on the shallow coastal aquifer of Port Said, Egypt. Frontiers in Earth Science, 11. https: //doi.org/10.3389/ feart.2023.1204742
Abdullahi, A. B., Siregar, A. R., Pakiding, W., and Mahyuddin., 2021. The analysis of BOD (Biological Oxygen Demand) and COD (Chemical Oxygen Demand) contents in the water of around laying chicken farm. IOP Conference Series: Earth and Enviro nmental Science, 788(1), 012155. https://doi.org/10.1088/1755-1315/78 8 /1/012155
Al-Gailani, A., Charpentier, T. V. J., Sanni, O., Crisp, R., Bruins, J. H., and Neville, A., 2020. Inorganic mineral pre cipi tation from potable water on heat transfer surfaces. Journal of Crystal Growth, 537, 125621. https: //doi. org/ 10.1016/j.jcrysgro.2020.125621
Benameur, T., Benameur, N., Saidi, N., Tartag, S., Sayad, H., and Agouni, A., 2022. Predicting factors of public awareness and perception about the quality, safety of drinking water, and pollution incidents. Environmental Monitoring and Assessment, 194(1), 2 2. https://doi.org/ 10.1007/s10661-02 1 -09557-2
Cañedo-Argüelles, M., Kefford, B. J., Piscart, C., Prat, N., Schäfer, R. B., and Schulz, C.-J. (2013). Salinisation of riv ers: An urgent ecological issue. Env ironmental Pollution,173, Pp.157–16 7.https://doi.org/10.1016/j.envpol.201 2.10.011
Dissanayake, C. B., and Chandrajith, R., 2018. The Hydrogeological and Geo chemical Characteristics of Gro und water of Sri Lanka, Pp. 405–428. Htt ps://doi.org/10.1007/978-981-10-388 9- 1_25
Fujita, H., Momose, M., and Pascual, T. V., 1990. Experimental research and devel opment study on water well construc tion in area where groundwater conta ins iron and manganese. Water Supply, 8(3), Pp. 402–410.
Gobalarajah, K., Subramaniam, P., Jayaw ardena, U. A., Rasiah, G., Rajendra, S., and Prabagar, J., 2020. Impact of water quality on Chronic Kidney Disease of unknown etiology (CKDu) in Thunu kkai Division in Mullaitivu District, Sri Lanka. BMC Nephrology, 21(1), Pp. 507.https://doi.org/10.1186/s12882-0 20-02157-1
Hossain, M. E., Shahrukh, S., and Hossain, S. A., 2022. Chemical Fertilizers and Pest icides: Impacts on Soil Degrada tion, Groundwater, and Human Health in Bangladesh. Pp. 63–92. https://doi. org/10.1007/978-3-030-95542-7_4
Hussain, M. S., Abd-Elhamid, H. F., Javadi, A. A., and Sherif, M. M., 2019. Mana gement of Seawater Intrusion in Coastal Aquifers: A Review. Water, 11(12), Pp. 2467. https://doi.org/10.3 390/w11122467
Indika, S., Wei, Y., Cooray, T., Ritigala, T., Jinadasa, K. B. S. N., Weragoda, S. K., and Weerasooriya, R., 2022. Groun dwater-Based Drinking Water Supply in Sri Lanka: Status and Perspectives. Water, 14(9), Pp. 1428. https://doi.or g/10.3390/w14091428
Islam, M. S., Mahmud, Z. H., Islam, M. S., Saha, G. C., Zahid, A., Ali, A. Z., Hassan, M. Q., Islam, K., Jahan, H., Hossain, Y., Hasan, M. M., Cairncross, S., Carter, R., Luby, S. P., Cravioto, A., Endtz, H. Ph., Faruque, S. M., and Clemens, J. D., 2016. Safe distances between groundwater-based water wells and pit latrines at different hydrogeological conditions in the Ganges Atrai floodplains of Bangla desh. Journal of Health, Population and Nutrition, 35(1), 26. https://doi. org/10. 1186/s41043-016-0063-z
Janakarajan, S., and Moench, M., 2018. Are Wells a Potential Threat to Farmers’ Well-being?: The Case of Deterior ating Groundwater Irrigation in Tamil Nadu, India. . In A. Prakash, C. G. Goo drich, and S. Singh (Eds.), Infor ming Water Policies in South Asia, Fir st Edition, Pp. 164–215. Routledge India.
Jayathunga, K., Diyabalanage, S., Frank, A. H., Chandrajith, R., and Barth, J. A. C., 2020. Influences of seawater intrusion and anthropogenic activities on shallo w coastal aquifers in Sri Lanka: eviden ce from hydrogeochemical and stable isotope data. Environmental Science and Pollution Research, 27(18), Pp. 23002–23014.https://doi.org/10.1007 /s11356-020-08759-4
Kanagaraj, G., Elango, L., Sridhar, S. G. D., and Gowrisankar, G., 2018. Hydroge ochemical processes and influence of seawater intrusion in coastal aquifers south of Chennai, Tamil Nadu, India. Environmental Science and Pollution Research, 25(9), Pp. 8989–9011. https: //doi.org/10. 1007/s11356-017-0910-5
Kanda, A., Murongazvombo, M., and Ncu be, F., 2017. Adapting household water use in rural Zimbabwe. Interna tional Journal of Environmental Studies, 74 (3),Pp. 471–485. https://doi.org/10.10 80/00207233.2017.1319622
Karwautz, C., and Lueders, T., 2014. Impact of Hydraulic Well Restoration on Native Bacterial Communities in Drinking Water Wells. Microbes and Environments, 29(4), Pp. 363–369. Ht tps://doi.org/10.1264/jsme2.ME14035
Khatri, N., and Tyagi, S., 2015. Influences of natural and anthropogenic factors on surface and groundwater quality in rural and urban areas. Frontiers in Life Science, 8(1), Pp. 23–39. https://doi. org/10.1080/21553769.2014.933716
Kothari, V., Vij, S., Sharma, S., and Gupta, N., 2021. Correlation of various water quality parameters and water quality index of districts of Uttarakhand. Envi ronmental and Sustainability Indicat ors, 9, 100093. https://doi.org/10.101 6/j.indic.2020.100093
Luby, S., Islam, Md. S., and Johnston, R., 2006. Chlorine spot treatment of floo ded tube wells, an efficacy trial. Jour nal of Applied Microbiology, 100 (5), Pp. 1154–1158. https://doi.org/10.11 11/j.1365-2672.2006.02940.x
Luque-Espinar, J. A., and Chica-Olmo, M., 2020. Impacts of Anthropogenic Activi ties on Groundwater Quality in a Detr itic Aquifer in SE Spain. Exposure and Health, 12(4), Pp. 681–698. https:// doi.org/10.1007/s12403-019-00327-7
Muzzillo, R., Zuffiano, L. E., Canora, F., Giorgio, G., De, L. P. P., Polemio, M., and Sdao, F., 2021. Hydrogeology And Seawater Intrusion Proneness In The Metaponto Plain Aquifer (Basilic ata, Italy). Italian Journal of Enginee ring Geology and Environ ment, Pp. 139–149.
Panabokke, C. R., and Perera, A. P. G. R. L., 2005. Groundwater resources of Sri Lanka. Water Resources Board.Perera, M. D. N. D., Ranasinghe, T. K. G. P., Piyadasa, R. U. K., and Jayasinghe, G. Y., 2018. Risk of seawater intrusion on coastal community of Bentota river basin Sri Lanka. Procedia Engineering, 212, Pp. 699–706. https:// doi.org/10. 1016/j.proeng.2018.01.090
Peters, N. E., and Meybeck, M., 2000. Water Quality Degradation Effects on Freshwater Availability: Impacts of Human Activities. Water International, 25(2), Pp. 185–193. https:// doi.org /10 .1080/02508060008686817
Ravindiran, G., Rajamanickam, S., Sivar ethinamohan, S., Karupaiya Sath aiah, B., Ravindran, G., Munia samy, S. K., and Hayder, G., 2023. A Review of the Status, Effects, Preven tion, and Rem ediation of Groundwater Contaminat ion for Sustainable Environment. Wate r,15(20),3662.https://doi.org/10.33 90/ w15203662
Reddy, D. V., Nagabhushanam, P., Mad hav, T., Chandrakala, P., and Red dy, A. G. S., 2015. Characterization of gro undwater contaminant sour ces in the coastal sand dune aquifer, Praka sam district, A.P. India. Enviro nmen tal Earth Sciences, 74(4), Pp. 3453–3466. https://doi.org/10.1007/s12665-015-4381-z
Samaraweera, K. D. A., Rajapakshe, R. R., Gunatilake, J., and Withanage, K. K. S. A., 2016. Assessment of Groundwater Quality and Quantity in Eastern Part of Ampara District , Sri Lanka. Water Resources Research in Sri Lanka, Symposium Proceedings of the Water Professionals’ Day.
Seelen, L. M. S., Flaim, G., Jennings, E., and De Senerpont Domis, L. N., 2019. Saving water for the future: Public awareness of water usage and water quality. Journal of Environmental Man agement, 242, Pp. 246–257.https:// doi. org/10.1016/j.jenvman.2019.04.047
Shoukat, A., Hussain, M., and Shoukat, A., 2020. Effects of Temperature on Total dissolved Solid in water. Water Qualit y Study Conference.
Some, S., Mondal, R., Mitra, D., Jain, D., Verma, D., and Das, S., 2021. Micr obial pollution of water with special reference to coliform bacteria and their nexus with environment. Energy Nex us,1,100008. https://doi.org/10.1016 /j. nexus.2021.100008
Wang, Z., Li, F., Xia, Y., Chen, H., Wang, K., Fu, S., and Wang, G., 2021. Spatial distribution of groundwater quality in the coastal plain and its relationship with land use and seawater intrusion. Environmental Earth Sciences, 80(14), Pp.465.https://doi.org/10.1007/s1266 5-021-09757-6
Zamani, M. G., Moridi, A., and Yazdi, J., 2022. Groundwater management in arid and semi-arid regions. Arabian Jou rnal of Geosciences, 15(4), Pp. 362. Ht tps://doi.org/10.1007/s12517-022-095 46-w
| Pages | 86-92 |
| Year | 2025 |
| Issue | 1 |
| Volume | 9 |
