
WATER LOSS PREDICTION MODEL FOR PIPE LEAKS IN WATER DISTRIBUTION NETWORKS LAID ON SLOPING TERRAINS
Journal: Water Conservation and Management (WCM)
Author: Rehan Jamil, Hamidi Abdul Aziz, Mohamad Fared Murshed
Print ISSN : 2523-5664
Online ISSN : 2523-5672
This is an open access article distributed under the Creative Commons Attribution License CC BY 4.0, which permits unrestricted use, distribution, and reproduction in any medium, provided the original work is properly cited
Doi: 10.26480/wcm.02.2023.128.136
Abstract
 One of the major elements affecting the working of a water distribution network (WDN) is the natural topography of the area on which it is laid, and when such a scenario is coupled with a pipe leak, the results are not known as yet. The effects of a sloping terrain on pressure distribution and transient state due to leakage in pipes are studied in detail in this research by considering three common types of pipe leaks. Significant results are obtained after the hydraulic simulation, and critical points are identified in the WDN. Statistical analysis is performed based on the data obtained through simulation results to develop a model for predicting the amount of flow through a leak in a WDN laid on sloping terrain. The model is found to be dependent on water demand, the pressure of water during the transient state, and the slope of a particular node from the main source of water. The model is validated by comparing the simulated values with the calculated ones and shows a good match. The research proves to be beneficial for better management of water distribution through pipe networks and overcoming water loss through pipe leaks.
Keywords
pipe leak; sloping terrain; water distribution; transient state; water loss; prediction model
1. Introduction
Among the causes for the beginning of a transient state within the WDN, pipe leakage has been a point of concern for researchers for a long time. The other transient-state conditions do not cause the loss of water, but in pipe leakage, there is a huge amount of water that could be lost if leakage analysis is not performed at the design stage. This unaccounted-for water causes a loss of financial and energy resources due to additional working of pumps to overcome this loss of water. The causes of leakage in pipes include the deterioration of pipes due to corrosion, bad workmanship, improper bedding under pipes, and excessive loads (Rodríguez et al., 2014).
Water distribution networks (WDN) experience two types of hydraulic conditions. First is the steady-state condition, which is a normal situation with permissible hydraulic parameters. The simulation of such kind of a condition is commonly termed Extended Period Simulation (EPS) or steady-state analysis, and it is spread over a time duration ranging from a few hours to several days. During this state, the pressures and the flow have no significant variations and more or less remain constant.
The second and most critical condition is the transient state condition. A transient state condition might arise due to the sudden closure of a valve creating a water hammer, shutting off or switching on a pump, and the appearance of pipe crack and resulting leakage (Chaudhry, 2014; Gseaa and Dekam, 2010). During this state, the flow and pressure inside the pipes have rapid changes. The simulation of transient state conditions is known as Short Period Simulation (SPS) or simply transient-state analysis, which usually focuses on the estimation of extreme pressures related to worst-case scenarios (Ramos et al., 2009). This condition sustains only for a few seconds or minutes; hence the duration of SPS is very small as compared to EPS. The main difference between both types of simulations is that EPS does not account for any sudden change in the momentum of water inside the pipe. So it is assumed that a steady-state condition prevails either before the start of the transient state or after the end of the transient state when the effects caused by it have settled down. On the other hand, we can easily say that a transient state occurs between two steady-state conditions, and SPS deals with the sudden change in momentum and its effects caused by any of the means mentioned above during the transient state.
Researchers have performed fruitful investigations regarding pipe leaks and the risk related to them over time. Underground-laid pipes may conceive cracks in their external or internal surfaces due to accidents or natural hazards. Three types of pipe cracks are very common named as circumferential cracks, round holes, and longitudinal cracks (Chaudhry, 2014; Rodríguez et al., 2014). Due to extensive bending, a kink may be produced in the pipe, which may result in a circumferential crack. A round hole may be formed accidentally in a pipe during some earthworks and heavy machinery, and also it may form due to corrosion over a long period. The third type of a crack is a longitudinal crack which is expected to be formed due to excessive internal water pressures.
Moslehi and Ghazizadeh determined the pressure-pipe break relationship in WDNs by using statistical analysis and presented significant results (Moslehi and Ghazizadeh, 2020). A group researchers worked on leakage and pressure-dependent demands and proposed a new integrated model (Conejos et al., 2017). Darweesh studied the effect of variable speed pumps on water quality through simulation (Darweesh, 2018). He created a few scenarios, including leakage, to study the effect. He concluded that the variable speed pumps harm the quality of water. A group researchers provided the concept of an equivalent leak for a pipe having multiple leaks and worked on the loss of energy and costs that occurred due to leaks in the pipes (Colombo et al., 2002). Zyl and Greyvenstein performed extensive experimental work on different materials of pipe to study the effects of pipe leakage (Zyl and Greyvenstein, 2007).
Figure 1: Types of Pipe Cracks with Respective Emitter Discharge Coefficients
They suggested a range of emitter discharge coefficients for several types of leaks for plastic, asbestos cement, and steel pipes. Their work provides a good guideline for extending the research regarding pipe leakages. In another work of Zyl along with his coworker Clayton, he studied the effect of soil hydraulics, water demand, and pipe material behavior on pipe leakage and emitter discharge coefficients (Zyl and Clayton, 2007). Schwaller and Zyl worked on the pressure-leakage relationship considering the variable and fixed leak area in the pipes (Schwaller and Zyl, 2014). A group researchers proved experimentally that a longitudinal crack might extend further, resulting in an increase in the opening due to the elastic behavior of the pipe material (Ilunga et al., 2018). Some group researcher, performed a numerical investigation on the effects of pressure on pipe cracks (Cassa et al., 2010). They concluded that the area of the leak opening increases with the increase in pressure.
A lot of work has been done on the subject of leak location and its detection system. A group researchers used the mechanism of the transient wave to develop a method of leak detection in plastic pipes by analysis (Pan et al., 2022). Similar work was done by who proposed a test procedure to detect the faults in pipelines by using transient base techniques (Meniconi et al., 2021). In other hand, researchers calibrated a WDN for leakage using pressure-driven analysis (Sousa et al., 2020). With the help of various computer-generated models, prepared an algorithm for leak detection (Adedeji et al., 2017). A group researchers performed experiments to determine the effects of leak size on leak detection (Ferrante et al., 2014). They concluded that in a transient state, with higher pressures at the leak location, the chances of leak detection decrease. Some researchers also used the method of support vector machine to determine the location of pipe leaks (Mashford et al., 2009). Qasem and Jamil developed a model for early detection of repair and maintenance of underground water pipes to avoid water loss through leakage (Qasem and Jamil, 2021).
A group researcher proposed a new methodology of using Artificial Neural Networks and fluid transients to detect leaks in piping systems (Bohorques et al., 2020). Various mathematical models have also been presented for the detection of leakage in water mains (Koppel et al., 2007; Giustolisi et al., 2008, Giustolisi et al., 2011). A group researchers provided an algorithm for leak localization, and provided the Nelder-Mead algorithm by using transient analysis for leak detection and pipe sizing (Meseguer et al., 2015; Choura et al., 2021). Some researchers used pressure sensitivity analysis to develop a methodology for the control and isolation of pipe leakages (Perez et al., 2011). In addition to this, leakage control models have also been found in the literature and previous works done by various authors (Araujo et al., 2006; Nicolini et al., 2011; Ahopelto and Vahala, 2020; Avila et al., 2021). some researcher used statistical modeling to develop an optimum regression relation for the loss of water depending on the length and the weighted mean age of the pipe by applying the minimum night flow method (Alkasseh et al., 2013). The use of WaterGEMS is also widely found in the literature for hydraulic analysis of WDNs during steady state as well as transient state conditions (Fereidooni et al., 2021; Kowalska et al., 2022; Pawa et al., 2019; Zaman et al., 2020).
For a community settled in plain areas, WDNs are fed by elevated water tanks or by a pump taking water from a groundwater tank to supply water with sufficient pressure and quantity. But when the natural topography of the area is sloping, it is preferred to construct the water tank at the higher elevation, and the WDN is spread over the lower area such that water is supplied with gravity flow without any need to use pumps or any other mechanical or electrical means. The hydraulics of such a WDN is different from that of lying on a plain area. The literature review presented in the above paragraphs somehow relates to water loss through leaks and the development of methods for its detection and repair, but no study is found discussing the effect of a pipe leak in a WDN that is laid on sloping terrains and resulting transient flow conditions due to it. Hence, this task was taken up to overcome the gap, and various hydraulic simulations were performed to study this aspect for water networks on sloping terrains, and highly significant results were obtained. The major objectives of this research can be listed as shown below.
- To assess the amount of water lost through different types of pipe cracks.
- To assess the effect of sloping terrain on the amount of water lost in water distribution networks.
- To develop a mathematical model for predicting the amount of water lost based on various parameters, including pressure, elevation, water demand, etc.
This research deals with the hydraulic aspects of such WDNs, which are laid over sloping terrains, and in particular, the effects of the transient state caused by pipe leakage on pressure are studied by using different types of pipe cracks. Later by using statistical techniques, a mathematical model is developed to predict the amount of water loss through a pipe leak in such scenarios.
2. Methodology And Analysis Options
The methodology adopted to achieve the objectives of the research is shown in a flow diagram in Figure 2, and it is further explained below:
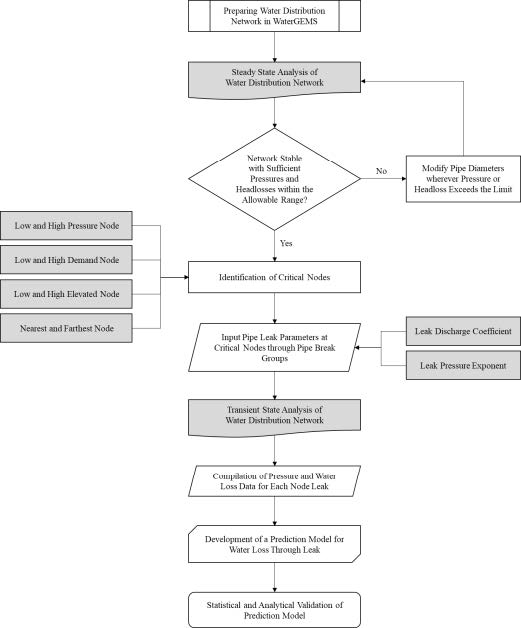
Figure 2: The Methodology of Research and Procedure of Analysis
2.1 Study Area Characteristics
The area selected for the research is an underdeveloped housing community in the vicinity of Islamabad, the capital city of Pakistan, located at 33o 28’ N, 73o 6’ E. The housing community is spread over an approximate area of 160 ha (1.6 km2), and it is planned for 3700 residential units along with commercial, educational, and recreational buildings and green areas. The expected population of the community is 20,000. The topography of the selected area is gradually sloping at 5-10%, with its highest points at the external ends and the lowest point at almost the middle of the area, with a maximum elevation difference of 50 m between the highest and lowest elevated points. The satellite imagery of the area showing the boundary of the research site and its contour plan showing variation in the elevation of different parts are shown in Figure 3.
The WDN for the area is supplied by two water tanks, one for the Eastern section and the other for the Western section of the community. The main source of water for the area is groundwater which is extracted with the help of tube wells. The water tanks are filled by using pumps and are located on comparatively elevated land to cater for the head losses in the whole network and to make sure that the water reaches every point in the network with sufficient pressure. Water Tanks 1 and 2 are circular, with a diameter of 15 m, a height of 20 m, and a water depth of 8 m, and they are located at a ground elevation of 508 m and 524 m, respectively. The WDN designed for the area consists of High-Density Poly Ethylene (HDPE) pipe material with a pressure rating of PN-16 which can sustain water pressure up to 16 bars (160 m). The network model in the WaterGEMS has a total of 179 nodes and 260 pipe sections. The detailed layout plan of the WDN for simulation is shown in Figure 5.
Figure 3: (a) Satellite Image with Area (Google Earth Pro, 2022) and (b): Elevation Contour Map
2.2 General Equations Used for Analysis
WaterGEMS is one of the best software for hydraulic simulation. The program is developed by Bentley, an Infrastructure Engineering Software Company in the USA. The software helps in assessing how water infrastructure behaves as a system, how it reacts to operational strategies, and how it should grow as population and demands increase. From fire flow and water quality simulations to criticality and energy cost analysis, WaterGEMS is a flexible multiplatform environment (WaterGEMS, 2022). WaterGEMS uses Hybrid Node-Loop Approach for the steady-state analysis of a WDN which is also known as the Gradient Method (Jamil, 2018). The program provides an option to select one of the methods of Hazen-William, Darcy-Weisbach, or Chezy-Manning for the calculation of frictional losses in the pipes. However, Hazen-William’s approach being the most accurate given by the following equation, was used for the said purpose in this research (Jamil, 2019).
where hL is the head loss in the total length of the pipe, L is pipe length in m, Q is the quantity of water flowing through the pipe in m3/s, C is the Hazen-Williams roughness coefficient, and D is the diameter of the pipe in m. For transient-state analysis arising from any reason, Reynold’s transport theorem is found useful. (Chaudhry, 2014). The derived continuity and momentum equations for analyzing the characteristics of a flow in a region of a pipe are shown below in Eq. 2 and 3, respectively.
where V is the volume of flow of water having density ρ, moving through a point x in the pipe of diameter D with a pressure p and at a time t.
Specifically, pipe leaks are modeled as emitters which are the devices associated with pipe junctions for simulating the flow through a nozzle or orifice (Chaudhry, 2014). Emitters are treated as the property of the junction in the program, and the flow through them can be determined by using the famous orifice equation, also known as the Fixed and Variable Area Discharge (FAVAD) equation (Chaudhry, 2014; Kabaasha, 2016).
where q is the flow rate through the orifice in m3/s, Cd is the discharge coefficient, A is the area of the orifice in m2, g is the acceleration due to gravity, and h is the pressure head at that location.
It is known that the flow rate through the emitter is a function of the pressure available at that junction.
Hence, the above equation, when applied to the pipe leaks and emitters,takes the general form as shown below.
where q is the flow rate in m3/s, CE is the emitter discharge coefficient which is generally measured in the units of (m3/s)/mα, P is the pressure available at the junction, and α is the emitter pressure exponent.
Eq. (5) is governed by two parameters mainly, which are the discharge coefficient and the pressure exponent (Colombo et al., 2002). The emitter discharge coefficient reflects the shape and size of the pipe leak, whereas the emitter pressure exponent reflects the flow regime through the pipe leak.
WaterGEMS uses Eqs. 2-5 for modeling pipe leaks and annexed transient state flow conditions. After obtaining the results for leaks at all pipe nodes from the software, the data is compiled, and a Multiple Linear Regression(MLR) analysis is performed to observe the relation between all the involved hydraulic parameters. For this research, it is assumed that the rate of flow of water through a leak (Qo) for a WDN spread on sloping terrain is dependent upon the actual water demand at that node (Qa), the water pressure at the node in the transient state (Pt), the pipe length from source to the node (L) and elevation difference (ΔH) of the node from the point of the water source. Also, it is known that the ratio of elevation to the length is the slope (So); hence the parameters can be shown in mathematical form as a function of Qo as Eq. (6) below.
where β1, β2, and β3 are the coefficients of the water demand, water pressure, and slope, whose values are determined by regression analysis.
For validation purposes and to get a relationship type among the values of all the variables, a multiple correlation coefficient is also measured to determine the reliability of the developed model as shown in Eq. 8 (Bluman, 2014).
where x and y are the values of the dependent and independent variables corresponding to the parameters mentioned in Eq. 6. A statistical program, EViews 11 is used for all types of advanced statistical analysis performed for the research. EViews 11 provides reliable analysis results and can perform any type of statistical, econometric analysis, forecasting, regression, and simulations.
For the pipe leak analysis, it is assumed that a buried pipe has developed a leak, but the nature of the leak is not known. To develop a universal relation involving a leak analysis, it is necessary to consider all possibilities of cracks that may exist. Different emitter discharge coefficients, CE, were used for all types of pipe cracks to simulate the leak. For circumferential crack, it was used as 0.47, for round hole, 0.524, and for longitudinal crack, a value of 1.62 was used (Greyvenstein and Zyl, 2007).
There has been an extensive discussion on the value of the emitter pressure exponent, α (Cassa and Zyl, 2014). The most common value of α is considered to be 0.5. But according to Rossman, this value of 0.5 is suggested for nozzles and sprinklers only and may not apply to pipe leakage (Rossman, 2020). A group researchers suggested a value of 1.2 for plastic pipes (Cobacho et al., 2015). Farley and Trow mentioned that, for pipe leaks, this value is significantly larger than 0.5 and typically varies between 0.5 and 2.79, with a median value of 1.15 (Farley and Trow, 2003). Some references show the use of the value of 1.18 (Araujo et al., 2003). They have accepted that the value is on the higher side but also provide a reason that it is not proven by the experimental results that the shape and size of the leak have any effect on this value. Hence the median value of 1.15 suggested by Farley and Trow is considered suitable for the emitter pressure exponent for the research (Farley and Trow, 2003).
The steady-state and transient-state analyses were run by using Hazen- Williams equation. A roughness coefficient of 150 was used for HDPE pipes (WaterGEMS, 2022; Jamil, 2018). The water demand at each node was calculated and assigned based on the design guidelines provided by the Capital Development Authority, Islamabad, Pakistan (CDA, 2020). A demand pattern for 24-hour was used for the consumption of water, which is a collection of multipliers that can be applied to a quantity to allow it to vary over time (Aquaveo, 2023). Within the specified interval of time, a quantity remains at a constant level, equal to the product of its nominal value and the pattern’s multiplier for that period. When the simulation exceeds the number of periods in a pattern, the pattern starts from its first value again (Rossman, 2020).
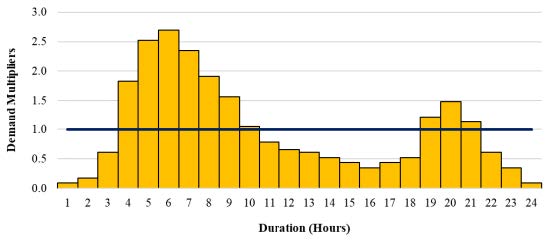
Figure 4: 24-Hour Water Demand Pattern (Aquaveo, 2023)
As the area under consideration is a residential community hence the pattern is based on general water consumption at homes for 24 hours. The demand multipliers were calculated such that they averaged 1 for 24 hours. Graphically the situation is represented in Figure 4.
3. Results And Discussion
3.1 Steady-State Analysis and Identification of Critical Nodes
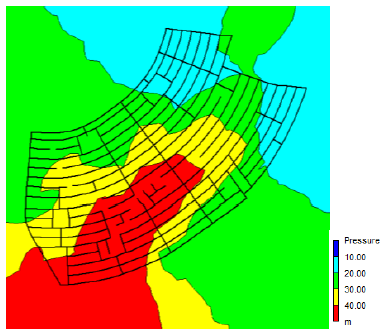
The initial steady-state analysis of the WDN was performed by considering no leak in the system and normal hydraulic parameters. A successful run was obtained, showing that the hydraulic performance of the network was good. The value of water pressure at all nodes was found to be within the acceptable range of 10 – 70 m, and the maximum head loss in a pipe section was found to be 50.3 m/1000m (5.03%) which is below the acceptable limit of 10% (Ghorbanian et al., 2016; IPC, 2021). The successful run also showed that there were no errors in creating the WDN, and all pipes were connected to the system. The pressure distribution at the peak demand hour for the no-leak situation is shown in Figure 5.
When Figure 2(b) and Figure 5 are compared, it shows the clear effect of topography on the pressure distribution. The area which is lower in elevation sustains higher values of water pressure, and the elevated areas of the network undergo lower pressure, yet no node in the system is found to be below 10 m at peak hour demand. The finalized network consists of a major water distribution pipe loop having a diameter of 65 mm, whereas other pipe branches and the main water supply pipe from water tanks consist of 75 mm to 150 mm as per the designed network.
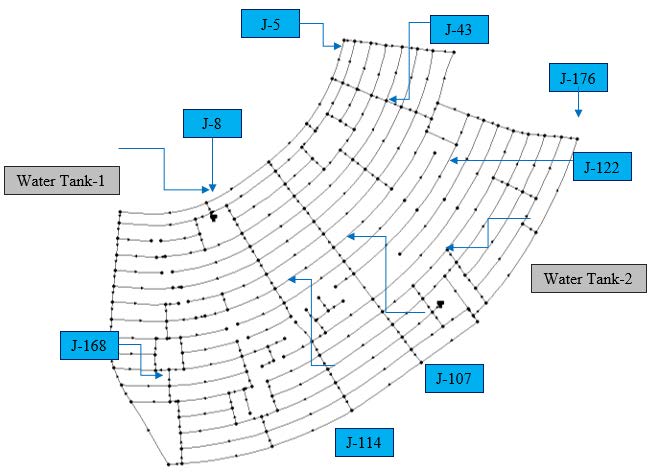
Following the results of the initial run, eight pipe junctions were identified as critical based on pressure, water demand, elevation, and distance from the water source. J-114 was selected for having the highest pressure of 52.69 m in the whole network, whereas the lowest pressure was recorded as 10.43 m at J-43. In the case of water demand, J-122 and J-107 were identified as having the highest and lowest water demands, with the value of 1.34 lps and 0.03 lps, respectively. Also, J-176 was selected to be the highest pipe junction in the network, with an elevation of 534 m, whereas the pipe node at the lowest point in the network was found to be J-168, with an elevation of 483 m. J-5 being the farthest junction from the water source, was also identified as critical, along with J-8 being the nearest pipenode. The location of all critical nodes is shown in Figure 6. J-8 and J-153 are the first pipe junctions for Water Tank-1 and Water Tank-2, respectively, before the distribution of water start in the form of major branches.
3.2 Pipe Leak Analysis
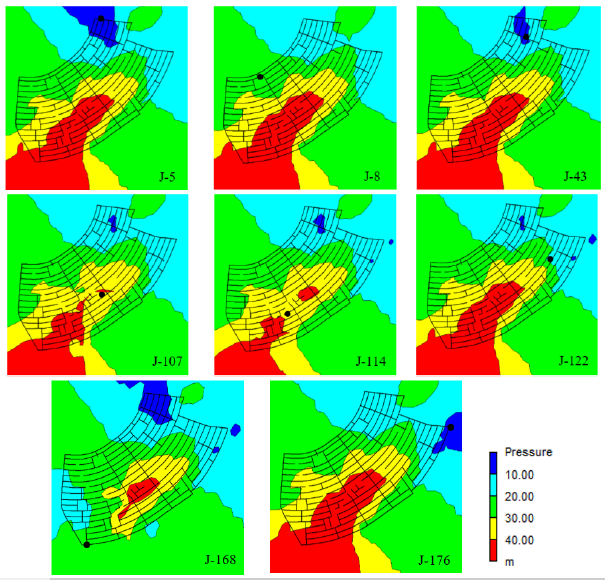
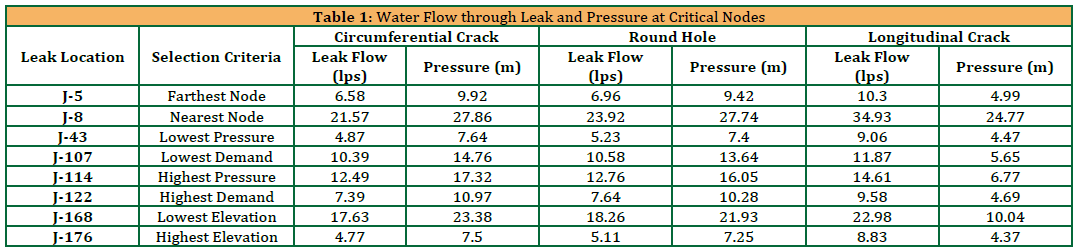
The leakage analysis for the WDN under study was performed at all eight critical junctions. Three types of pipe cracks, as discussed in Section 2.3, were introduced at all the critical nodes one by one by importing the value of emitter discharge coefficients (CE) through Pipe Break Groups in WaterGEMS and their effect on the pressure of water during transient state and water loss for the whole network was studied. The results obtained are discussed as under. Figure 7 shows the pressure distribution obtained for the water network when a circumferential crack was introduced at all critical nodes. The leak at J-5 caused a pressure drop of almost 35%. This is because J-5 is the farthest node in the network from the water source. A leak at J-8, which is near Water Tank-1, caused a minimum effect of pressure, and the difference remains less than 1% in the whole network at all other nodes. But on the other hand, the amount of leak through J-8 is found to be highest in all critical nodes with a value of 21.57 lps, as shown in Table 1. The reason is that this node lies just at the start of the network and results in most of the amount of water loss. For a circumferential crack highest pressure loss is found to be in the case of J-168, which is at the lowest point in the whole network, and the loss of pressure exceeds 50% at this location. The pressure drop at all other critical nodes was observed to be between 10-15%.
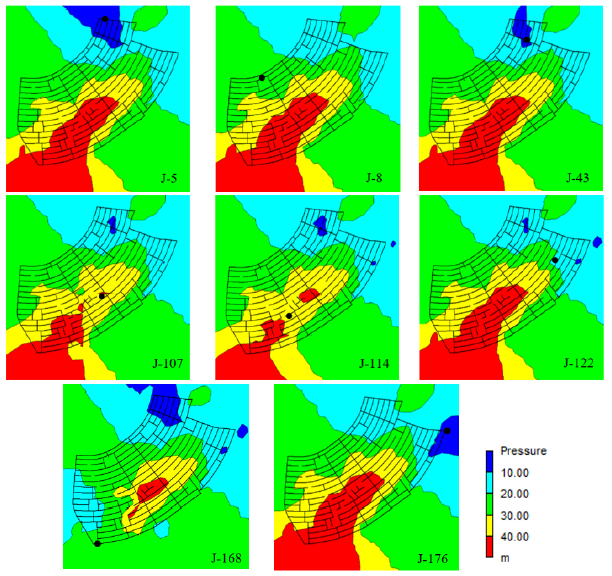
A nominal difference was observed in the trend of pressure loss when a round hole was introduced at the critical nodes as compared to a circumferential crack. The reason is the closer values of CE. The pressure loss becomes 38% for a leak at J-5, and it is observed as 57% at J-168 for a round-hole pipe leak. The pressure distribution seems quite similar for circumferential crack and a round hole for the water network, as shown in Figure 7 and 8. The pressure drop at other critical nodes was observed to be between 13-18%. However, the amount of water leak was slightly higher at all nodes in this case as compared to that of the circumferential crack. The maximum value of 23.92 lps for leak flow was observed at J-8.
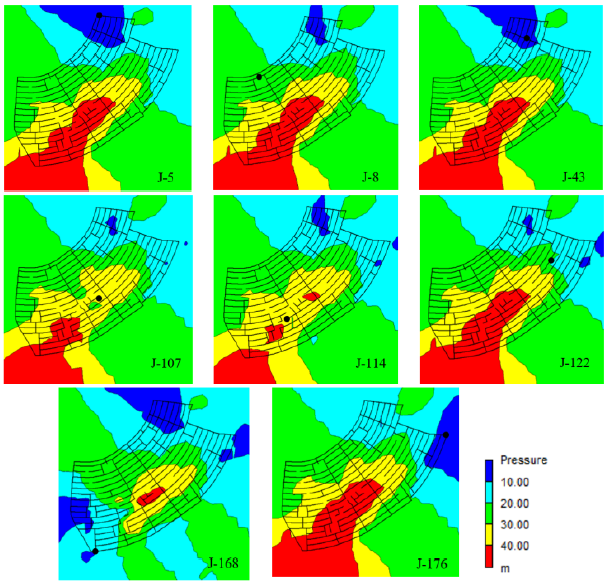
A huge difference was observed in the pressure loss in the network when a longitudinal crack was introduced at the critical nodes. The pressure loss jumps to 67% and 80% at J-5 and J-168, respectively. Also, at all other critical nodes, it increases to 20-25%. It is important to note that the maximum amount of flow through the leak is observed at all selected nodes for this type of pipe leak, as shown in Table 1. A lot of blue color patches can be seen in Figure 9, depicting a pressure of fewer than 10 m, indicating that the network is failing in those areas when there is a longitudinal crack in any pipe section of the network. The maximum value of flow-through leak is observed as 34.93 lps at J-8 followed by 22.98 lps at J-168.
3.3 Development of Water Loss Prediction Model
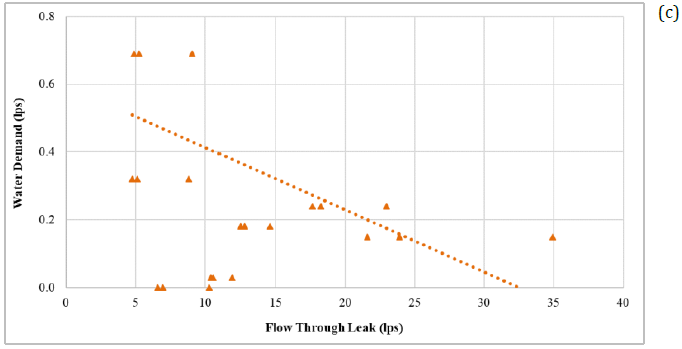
After compiling the data on the flow rate of water through a leak along with other parameters for all cases, as shown in Table 1, a statistical analysis was performed to develop a relationship to predict the rate of flow through any pipe leak for a network laid on sloping terrain. A multiple linear regression (MLR) analysis between the related parameters discussed in Eq. 4 is plotted as shown in Fig. 10(a-c). The plot shows that the values of flow through a leak have a good relationship with water pressure, slope, and water demand. The analysis provided the coefficients of the dependent parameters of Eq. 5, and the mathematical model can now be written as Eq. 7 below.
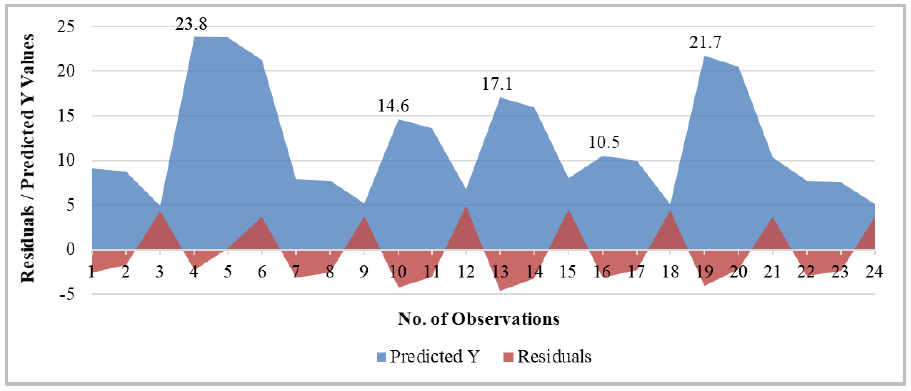
The multiple correlation coefficient (Ri) for the developed statistical model was found to be 0.934, which is an excellent value for measuring the reliability of a statistical model. The value also shows that there is a strong positive relationship among the values of all variables. Moreover, the plot of residuals obtained through EViews 11 software for the regression analysis shows that for any Predicted-Y value, all residuals are lying within a 95% confidence interval and do not exceed the range of ±5%, as shown in Figure 11.
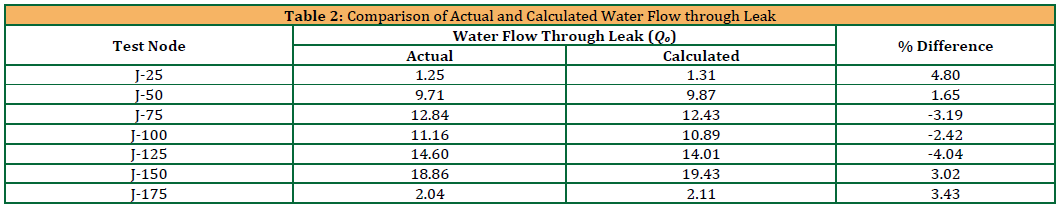
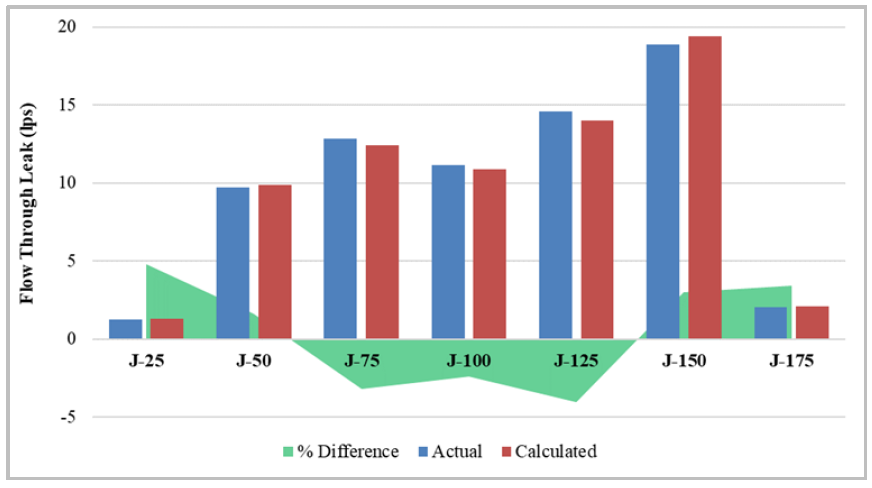
To check the reliability of the developed model, various types of pipe leaks were introduced at a few additional nodes within the WDN to check the flow through the leak. The obtained values were compared with that calculated by using the proposed model for validation. The comparison and difference in values are shown in Table 2, and the data is plotted in Fig. 12, which shows the percentage difference is well within ±5%. For this low percentage difference value, it can be said with confidence that the developed model is highly reliable and can be used to predict the value of flow-through pipe leaks for WDNs under transient states laid on sloping terrains.
4. Conclusions And Recommendations
Hydraulic simulation for a water distribution network, spread over gradually sloping terrain, was performed considering pipe leaks at various critical locations. Three different types of pipe cracks, namely circumferential crack, round hole, and longitudinal crack, were introduced in eight identified critical nodes one at a time to study the effect of leakage of water and pressure distribution at various locations of the network. Among all identified critical nodes, the nearest node and the node at the lowest elevation came out to be the most critical ones. The nearest node J-8, contributed the most to the loss of water when a leak was introduced at that location. On the other hand, J-168, which is the lowest node in terms of elevation, showed a considerably high amount of water leak, and in addition to this, it disturbed the pressure distribution of the whole network as well. Hence it can be deduced that a leak introduced at the extreme upstream location of the network causes the minimum damage to the pressure distribution, whereas a leak introduced at the extreme downstream point of the network may cause a highly significant pressure drop in the whole network.
Based on the results, an extensive statistical analysis produced a well reliable model to predict the amount of flow of water through a pipe leak in water distribution networks laid on sloping terrains. The prediction model was validated by statistical means as well as by the analytical method after comparing the values obtained through simulation and calculations. The critical points identified mentioned in this research can be taken care of properly with regular checks and inspections, and in the case of any accidental rupture of pipe, proper action can be taken for repair and rehabilitation immediately. The research proves to be very useful for the management, planning, and maintenance of water distribution networks in terms of the prevention of water loss caused by a pipe leak.
Conflict Of Interest
There is no conflict of interest to declare.
Data Availability Statement
The datasets generated and analyzed during the research are available with the corresponding author and can be furnished upon request.
References
- Adedeji, K.B., Hamam, Y., Abe, B.T., Abu-Mahfouz, A.M., 2017. Leakage Detection and Estimation Algorithm for Loss Reduction in Water Piping Networks, Water, 9 (10), Pp. 773
- Ahopelto, S., Vahala, R., 2020. Cost-Benefit Analysis of Leakage Reduction Methods in Water Supply Networks, Water, 12, Pp. 195.
- Alkasseh, J.M.A., Adlan, M.N., Abustan, I., Aziz, H.A., Hanif, A.B.M., 2013. Applying Minimum Night Flow to Estimate Water Loss Using Statistical Modeling: A Case Study in Kinta Valley, Malaysia. Water Resources Management, 27, Pp. 1439-1455
- Aquaveo, 2023. Aquaveo, LLC, https://www.aquaveo.com/
- Araujo, L.S., Coelho, S.T., Ramos, H., 2003. Estimation of distributed pressure-dependent leakage and consumer demand in water supply networks, Advances in Water Supply Management: Proceedings of Computing and Control for the Water Industry – CCWI 2003, Sep 15-17, Imperial College, London, UK
- Araujo, L.S., Ramos, H., Coelho, S.T., 2006. Pressure Control for Leakage Minimisation in Water Distribution Systems Management. Water Resources Management, 20 (1), Pp. 133–149.
- Avila, C.A.M., Sanchez-Romero, F.J., Lopez-Jimenez, P.A., 2021. Leakage Management and Pipe System Efficiency. Its Influence in The Improvement of the Efficiency Indexes. Water, 13, Pp. 1909.
- Bentley, 2022. OpenFlows WaterGEMS: Overview, Bentley Systems, Infrastructure Engineering Software Company, The United States Environmental Protection Agency, https://www.bentley.com/software/openflows-watergems/
- Bluman, A., 2014. Elementary Statistics – A Step by Step Approach, McGraw-Hill Education New York, ISBN 9780073534985
- Bohorquez, J., Alexander, B., Simpson, A.R., Lambert, M.F., 2020. Leak Detection and Topology Identification in Pipelines Using Fluid Transients and Artificial Neural Networks. Journal of Water Resources Planning and Management, 146 (6), Pp. 0402-0040.
- Cassa, A.M., Zyl, J.E.V., 2014. Predicting the leakage exponents of elastically deforming cracks in pipes, 12th International Conference on Computing and Control for the Water Industry. CCWI 2013, Procedia Engineering, 70, Pp. 302-310.
- Cassa, A.M., Zyl, J.E.V., Laubscher, R.F., 2010. A numerical investigation into the effect of pressure on holes and cracks in water supply pipes. Urban Water Journal, 7 (2), Pp. 109-120.
- CDA, 2020. Modalities and Procedures for Development of Private Housing/Farm Housing Schemes, The Gazette of Pakistan, Capital Development Authority, Islamabad, Pakistan, Doc. No. 5104(20)/Ex. Gaz.
- Chaudhry, M.H., 2014. Applied Hydraulic Transients, Springer, ISBN: 978-1-4614-8537-7
- Choura, O., Capponi, C., Meniconi, S., Elaoud, S., Brunone, B., 2021. A Nelder-Mead Algorithm-Based Inverse Transient Analysis for Leak Detection and Sizing in a Single Pipe. Water Supply, 21 (4), Pp. 1580-1593
- Cobacho, R., Arregui, F., Soriano, J., Cabrera, E., 2015. Including leakage in network models: an application to calibrate leak valves in EPANET. Journal of Water Supply: Research and Technology-Aqua, 64 (2), Pp. 130-138.
- Colombo, A.F., Karney, B.W., 2002. Energy and Costs of Leaky Pipes: Toward Comprehensive Picture, Journal of Water Resources Planning and Management, 128 (6), Pp. 441-450.
- Conejos, M.P., Alzamora, F.M., Alonso, J.C., 2017. A water distribution system model to simulate critical scenarios by considering both leakage and pressure dependent demands, XVIII International Conference on Water Distribution System Analysis, WDSA 2016, Procedia Engineering, 186, Pp. 380-387.
- Darweesh, M., 2018. Impact of variable speed pumps on water quality in distribution systems. Water SA, 44 (3), Pp. 419-427.
- Farley, M., Trow, S., 2003. Losses in Water Distribution Networks: A Practitioner’s Guide to Assessment, Monitoring and Control, IWA Publishing, London, United Kingdom
- Fereidooni, Z., Tahayori, H., Jahromi, A.B., 2021. A hybrid model‑based method for leak detection in large scale water distribution networks, Journal of Ambient Intelligence and Humanized Computing, 12, Pp. 1613–1629.
- Ferrante, M., Brunone, B., Meniconi, S., Karney, B.W., Massari, C., 2014. Leak Size, Detectability and Test Conditions in Pressurized Pipe Systems, Water Resources Management, 28 (3), Pp. 4583–4598.
- Ghorbanian, V., Karney, B., Guo, Y., 2016. Pressure Standards in Water Distribution Systems: Reflection on Current Practice with Consideration of Some Unresolved Issues, Journal of Water Resources Planning and Management, 142 (8), Pp. 1-8.
- Giustolisi, O., Laucelli, D., 2011. Water Distribution Network Pressure-Driven Analysis Using the Enhanced Global Gradient Algorithm (EGGA), Journal of Water Resources Planning and Management, 137 (6), Pp. 498-510.
- Giustolisi, O., Savic, D., Kapelan, Z., 2008. Pressure-Driven Demand and Leakage Simulation for Water Distribution Networks. Journal of Hydraulic Engineering, 134 (5), Pp. 626-635.
- Google Earth, 2022. https://www.google.com/earth/
- Greyvenstein, B., Zyl, J.E.V., 2007. An experimental investigation into the pressure-leakage relationship of some failed water pipes. Journal of Water Supply: Research and Technology-Aqua, 56 (2), Pp. 117-124.
- Gseaa, F.S., Dekam, E.I., 2010. Pressure Transient in Pipe Networks: Simulation and Analysis. Journal of Engineering Research, 10, Pp. 39-52.
- Ilunga, T.D., Dinka, M.O., Madyira, D.M., 2018. The Effect of the Pipe Material on the Behaviour of Water Leakage through Longitudinal Cracks under Pressure, Water Loss Conference 2018, Cape Town, South Africa
- IPC, 2021. International Plumbing Code, International Code Council, USA, ISBN: 978-1-60983-962-8
- Jamil, R., 2018. Performance of a New Pipe Material UHMWPE against Disinfectant Decay in Water Distribution Networks, Clean Technologies and Environmental Policy, 20 (6), Pp. 1287-1296.
- Jamil, R., 2019. Frictional Head Loss Relation between Hazen-Williams and Darcy-Weisbach Equations for Various Water Supply Pipe Materials. International Journal of Water, 13 (4), Pp. 333-347.
- Kabaasha, A.M., Zyl, J.E.V., Piller, O., 2016. Modelling Pressure-Leakage Response in Water Distribution Systems Considering Leak Area Variation, 14th CCWI International Conference on Computing and Control in Water Industry, CCWI 2016, Amsterdam, Germany, Pp. 1-7.
- Koppel, T., Ainola, L., Puust, R., 2007. A mathematical model for the determination of leakage in mains and water distribution networks. Estonian Journal of Engineering, 13 (1), Pp. 3-16.
- Kowalska, B., Suchorab, P., Kowalski, D., 2022. Division of district metered areas (DMAs) in a part of water supply network using WaterGEMS (Bentley) software: A case study, Applied Water Science, 12, Pp. 166.
- Mashford, J., Silva, D.D., Marney, D., Burn, S., 2009. An approach to leak detection in pipe networks using analysis of monitored pressure values by support vector machine, Third International Conference on Network and System Security, NSS 2009, Queensland, Australia, Pp. 534-539.
- Meniconi, S., Capponi, C., Frisinghelli, M., Brunone, B., 2021. Leak Detection in Real Transmission Main through Transient Tests: Deeds and Misdeeds, Water Resources Research, 57, Pp. 027838.
- Meseguer, J., Tur, J.M.M., Cembrano, G., Puig, V., 2015. Model-based monitoring techniques for leakage localization in distribution water networks, 13th Computer Control for Water Industry Conference, CCWI 2015. Procedia Engineering, 119, Pp. 1399-1408.
- Moslehi, I., Ghazizadeh, M.J., 2020. Pressure-Pipe Breaks Relationship in Water Distribution Networks: A Statistical Analysis. Water Resources Management, 34, Pp. 2851-2868.
- Nicolini, M., Giacomello, C., Deb, K., 2011. Calibration and Optimal Leakage Management for a Real Water Distribution Network. Journal of Water Resources Planning and Management, 137 (1), Pp. 134-142.
- Pan, B., Capponi, C., Meniconi, S., Brunone, B., Duan, H.F., 2022. Efficient Leak Detection in Single and Branched Polymeric Pipeline Systems by Transient Wave Analysis. Mechanical Systems and Signal Processing, 162, Pp. 108084.
- Pawar, M.M., Sonaje, N., Bagal, S.C., 2019. Commercial Viability Analysis for Converting Conventional Water Supply System into 24×7 Water Supply Systems by Using Water Gems, Proceedings of the 2nd International Conference on Advanced Technologies for Societal Applications, 1, Techno-Societal, Pp. 887-894.
- Perez, R., Puig, V., Pascual, J., Quevedo, J., Landeros, E., Peralta, A., 2011. Methodology for leakage isolation using pressure sensitivity analysis in water distribution networks. Control Engineering Practice, 19, Pp. 1157-1167.
- Qasem, A., Jamil, R., 2021. GIS-Based Financial Analysis Model for Integrated Maintenance and Rehabilitation of Underground Pipe Networks. Journal of Performance of Constructed Facilities, 35 (5), Pp. 1-8.
- Ramos, H., Tamminen, S., Covas, D., 2009. Water Supply System Performance for Different Pipe Materials Part II: Sensitivity Analysis to Pressure Variation. Water Resources Management, 23, Pp. 367–393.
- Rodríguez, J.M., Galván, X.D., Ramos, H.M., Amparo, P.A.L., 2014. An overview of leaks and intrusion for different pipe materials and failures. Urban Water Journal, 11 (1), Pp. 1-10.
- Rossman, L.A., Woo, H., Tryby, M., Shang, F., Janke, R., Haxton, T., 2020. EPANET 2.2 User Manual, Water Infrastructure Division. Centre for Environmental Solutions and Emergency Response, USEPA, Cincinnati OH.
- Schwaller, J., Zyl, J.E.V., 2014. Modeling the Pressure-Leakage Response of Water Distribution Systems Based on Individual Leak Behavior. Journal of Hydraulic Engineering, 141 (5), Pp. 0401-4089.
- Sousa, J., Martinho, N., Muranho, J., Marques, A.S., 2020. Leakage Calibration in Water Distribution Networks with Pressure-Driven Analysis: A Real Case Study. Environmental Science Proceedings, 2, Pp. 59.
- WaterGEMS, 2022. Bentley WaterGEMS User’s Guide, Document No. DAA038650-1/0001
- Zaman, D., Tiwari, M.K., Gupta, A.K., Sen, D., 2020. A review of leakage detection strategies for pressurised pipeline in steady-state. Engineering Failure Analysis, 106, Pp. 104-264.
- Zyl, J.E.V., Clayton, C.R.I., 2007. The Effect of Pressure on Leakage in Water Distribution Systems. Proceedings of the Institution of Civil Engineers – Water Management, 160 (2), Pp. 109-114.
| Pages | 128-136 |
| Year | 2023 |
| Issue | 2 |
| Volume | 7 |
