STUDY OF THE POTENTIAL OF THE PURWOKERTO-PURBALINGGA GROUNDWATER BASIN AS A SOURCE OF IRRIGATION USING GRAVIMETRIC SATELLITE DATA
Journal: Water Conservation and Management (WCM)
Author: Sehah, Abdullah Nur Aziz, Sukmaji Anom Raharjo, Sherina Cikal Buliyanti, Fuad Mubarak, Gigih Ferdyanthaariq Wicaksono, Widad Asahi
Print ISSN : 2523-5664
Online ISSN : 2523-5672
This is an open access article distributed under the Creative Commons Attribution License CC BY 4.0, which permits unrestricted use, distribution, and reproduction in any medium, provided the original work is properly cited
Doi: 10.26480/wcm.02.2024.140.149
Abstract
 Satellite data-based gravity anomaly data mapping on the Earth’s surface has been widely carried out, especially for large areas, such as groundwater basins. One of the largest basins on Java Island, Indonesia, is the Purwokerto-Purbalingga Groundwater Basin. This research proposes to study the potential of the Purwokerto-Purbalingga Groundwater Basin as a source of irrigation using satellite gravity anomalies data supported by resistivity data. Gravity anomaly data were accessed from GGM Plus data with a spatial resolution of 220 m. Data processing, which includes several corrections and reductions, produced residual gravity anomalies data. Inversion modeling of the residual anomalies data resulted in a subsurface rock structure model with density values ranging from 1.20 – 4.80 g/cm3. The modeling results show a form of a geological basin filled with alluvial deposits with estimated density values ranging from 2.10 – 2.55 g/cm3. These interpreted results are in accordance with the relatively small resistivity data throughout the research area, ranging from 0.37 – 72.75 m, which are interpreted to be dominated by sand and clayey sand. It indicates that the Purwokerto-Purbalingga Groundwater Basin area has good potential as a water source for agricultural irrigation and other living needs.
Keywords
Alluvial Deposits, Groundwater-Based Agricultural Irrigation, Subsurface Rocks, Resistivity Logs, GGM Plus data.
1. INTRODUCTION
Groundwater is one of the main components in the hydrologic cycle on the Earth. It comes from rainwater which seeps into the soil and rocks through pores and cracks in the recharge areas. Groundwater flows and is stored in the tiny open spaces between rock, sand, soil, and gravel in the subsurface, referred to as an aquifer, and is often located in the discharge area of a groundwater basin. A groundwater basin is a depressions on the Earth’s surface bounded by hydrogeological boundaries. All groundwater dynamic processes like recharge, drainage, and disposal occur here (Demiroglu, 2017). Groundwater plays a key role in maintaining the balance and availability of freshwater for households, agriculture, livestock, and industries. One of the groundwater basins in Indonesia which is worth investigating is the Purwokerto-Purbalingga Basin, since this basin is a vast groundwater basin in Central Java with an area of around 1,318 km2 (Ramadhan, 2020). The information and data obtained from this research are beneficial for supporting the development of groundwater-based agricultural irrigation.
One of the widely used geophysical data to study geological structures and explore the subsurface natural resources, such as groundwater aquifer, is gravimetric satellite data. Gravimetric satellite data proved to be very good when it is used for modeling and interpreting the magma chamber of the Slamet Volcano, the geothermal exploration, the Great Sumatran Fault, the geological structure in the oil and gas prospective area, and the subsurface geological structure of Mount Merapi and Merbabu (Sehah et.al., 2022; Zhao et.al., 2023; Indriana et.al., 2019; Yanis et.al., 2019; Adamu et.al., 2022; Maghfira et.al., 2019). Gravimetric satellite data is also widely applied to explore several natural resources, such as coal, bauxite, zinc, and other ores that are very difficult to explore using other survey methods because of the extreme and impossible conditions. On a large scale, numerous offshore mapping activities also use gravimetric satellite data (Nguyen et.al., 2020; Setiadi et.al., 2021). While in the context of groundwater explorations, these data have also been widely used, such as in the exploration of groundwater sources in Wadi Ar-Rahmah, Saudi Arabia (Mohamed and Alshehri, 2023).
The interpretation results of gravity anomaly data related to groundwater potential in a basin are generally supported by resistivity data. These data can be obtained through a resistivity survey to identify the electrical properties of subsurface rocks. The resistivity method has been applied to identify aquifer characteristics in Maninjau Lake, Sumatra Island (Sehabuddin et.al., 2019). This method has also been successfully used to detect aquifer characteristics at the ITO Campus area, Kyushu University, Fukuoka, Japan (Wahab et.al., 2021). The author has succeeded in using the resistivity method to obtain a cross-section of the hydrostratigraphic model of the Serayu River bank area in Sokawera Village, Somagede District, Banyumas Regency, Central Java, Indonesia (Sehah et.al., 2021). The author also succeeded in applying the same method to detect the depth of the aquifers and compared the results with well-logging in Jatilawang District, Banyumas Regency, Central Java, Indonesia (Handika and Sehah, 2020). Detection of the groundwater depth using the resistivity method has been tested with a rate of accuracy of up to 80% (Anonimous, 2015).
The geological information of the research area is based on three geological maps, consisting of the Purwokerto-Tegal sheet, the Banyumas sheet, and the Pekalongan-Banjarnegara sheet ((Djuri et.al., 1996; Asikin and Handoyo, 1992; Condon et.al., 1996). Figure 1 shows the redrawing result of the geological map of the research area. Based on the map, the Purwokerto-Purbalingga Basin area is estimated to consists of some stratigraphic units. Some of the stratigraphic units are alluvium (Qa) which consists of gravel, sand, silt, and clay which are deposits from the river and coast with a thickness of 150 m; laharic deposits (Qls) which consist of lahar rocks with boulders of andesitic-basaltic volcanic, 10-50 cm in diameters; lava of Slamet Volcano (Qvls) which consists of porous andesite lava; undifferentiated volcanic rocks (Qvs) which consist of volcanic breccia, lava, and tuff, spread out to form plains and hills; terrace deposits (Qps) that consist of layers of sand, tuff, tuffaceous sandstone, tuffaceous breccia, and conglomerate; Tapak formation (Tpt) which consists of greenish coarse-grained sandstone and conglomerate rock, local andesitic breccia, where upper part consists of calcareous sandstone and green marl with mollusk fragments (Asikin and Handoyo, 1992).
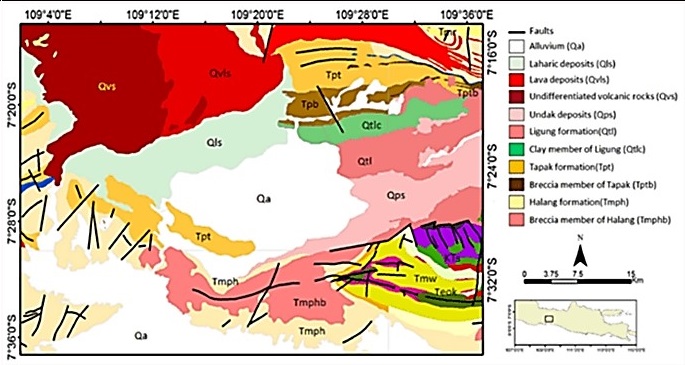
Figure 1: A geological map of the Purwokerto-Purbalingga Groundwater Basin area.
2. MATERIAL AND METHODS
2.1 Location and Time
This study has been carried out at the Electronics, Instrumentation and Geophysics Laboratory, Faculty of Mathematics and Natural Sciences, Jenderal Soedirman University. The data used in the research is gravimetric satellite data from the GGM Plus, covering the Purwokerto-Purbalingga Groundwater Basin, stretching at the position of 109.0083° – 109.6083°E and 7.2554° – 7.6026°S, as shown in Figure 2. The research was carried out for eight months, i.e. March – October 2023.
2.2 Research Equipment
For the gravity method, the equipment used in the research includes a laptop equipped with several application programs and software, i.e. Microsoft Excel, Grablox 1.7, Bloxer 1.6e, Fortran 77, and others. The materials used are satellite gravity anomalies data of GGM Plus, which consist of gravity disturbance data, quasi-geoid data, and geographical position data (x,y,z) of the research area (Zheng et.al., 2022). The data from GGM Plus can be accessed from the website provided by Bureau Gravimetrique International (BGI, 2013). For the resistivity method, the equipment used includes the Resistivity-meter type NRD-22S NANIURA equipped with 2 pcs 200 m cables, 2 pcs 100 m cables, 2 pcs current electrodes, 2 pcs potential electrodes, 12V-DC battery, several application programs for data processing and modeling, and other supporting tools.
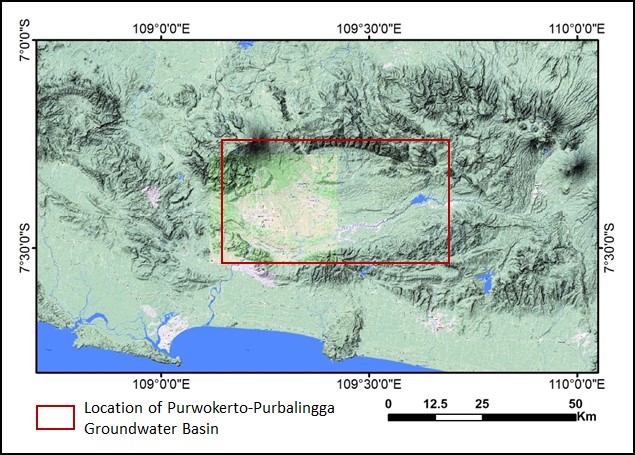
Figure 2: The Purwokerto-Purbalingga Groundwater Basin area map, Central Java, Indonesia (Source: Google Earth).
2.3 Research Procedure
Accessing the GGM Plus gravity anomalies data is the first step in the research. The obtained data consists of gravity disturbance data, whose values are equivalent to free-air gravity anomalies data, geoid elevation data, and the geographic position of all data points (Perozzi et.al., 2021). The Complete Bouguer Anomalies (CBA) data will be obtained after Bouguer and terrain corrections are applied to the free-air gravity anomalies data (Maulana and Prasetyo, 2019). As is generally the case with gravity data processing, CBA data that still spread over the topographic surface, are then reduced to the horizontal surface (at an average height of the research area) and cleaned from the regional gravity effects (Sehah et.al., 2023; Blakely, 1995). The obtained final result of the data processing is residual gravity anomalies data representing the subsurface geological structure of the research area (Sehah et.al., 2023).
Furthermore, the inversion modeling is applied to the residual gravity anomalies data to obtain a density distribution model of subsurface rocks in the research area. The results of the interpretation of the subsurface rock density model indicate variations in rock types, wherein rocks with low densities can be interpreted as alluvial deposits that have the potential to store large amounts of groundwater. The next stage of the research is to acquire resistivity data from parts of the basin that has the potential to contain groundwater based on the subsurface rock density distribution. The processing results of resistivity data show that the aquifer layer depth in the groundwater basin is usually characterized by small resistivity values (Syafnur et.al., 2023).
3. RESULTS AND DISCUSSION
3.1 Results of Gravity Data Processing
Gravity anomalies data from GGM Plus were accessed on March 1-2, 2023. The accessed data, which are 51,900 in number, spread within a range of positions from 109.0083° – 109.6083°E and 7.2554° – 7.6026°S. They result in gravity disturbance data whose values are equivalent to free air gravity anomalies data (Supriyanto et.al., 2021). The gravity disturbance data ranges from 57.51 – 287.06 mGal with a contour map that can be seen in Figure 3, while the elevation data of the research area topography ranges from -19.91 – 2606.64 m, with a contour map that can be seen in Figure 4. The GGM plus data has a spatial resolution of 220 meters per grid, much better than other satellite gravity data (Camacho and Alvarez, 2021). Thus these data are very effective for exploring areas that are not too large.
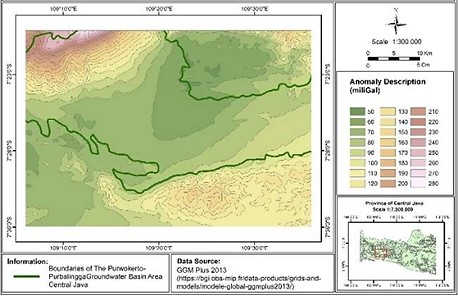
Figure 3: The free air gravity anomalies contour map of the research area
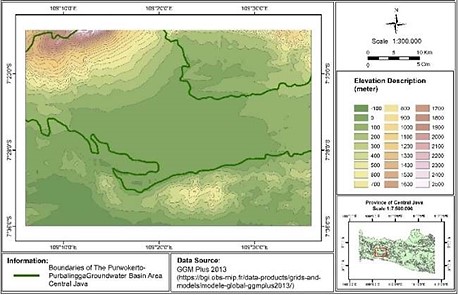
Figure 4: The topographic contour map of the research area.
The applied Bougeur and terrain corrections produce the Complete Bougeur Anomalies (CBA) data with values 59.18 – 127.85 mGal. Figure 5 shows the CBA contour map over the topographic surface. After the CBA data are reduced to the horizontal surface using the Taylor series approximation, the CBA data distributed over an average elevation of the research area (i.e. 243.92 m) is resulted. Next, the regional-residual anomalies data are separated using the upward continuation technique (Indrawati et.al., 2020; Blakely, 1995). Regional anomalies data can be assumed to originate from very deep subsurface anomalous. The remaining CBA data produces residual gravity anomalies data corresponding to the density distribution of subsurface rock in the study area, with values ranging from -26.48 – 41.29 mGal (Biswas, 2015). The residual gravity anomalies map is shown in Figure 6.
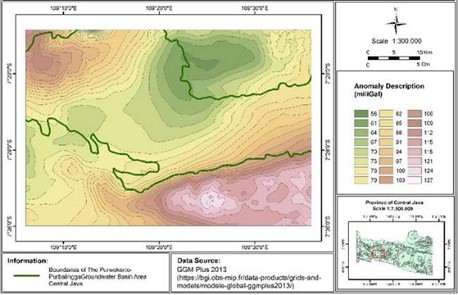
Figure 5: The CBA contour map of the research area.
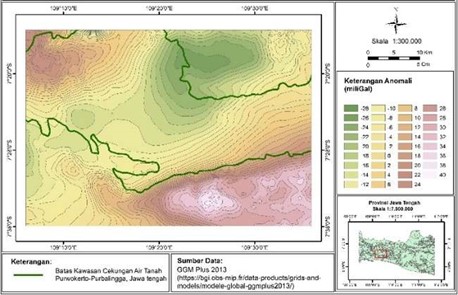
Figure 6: The residual gravity anomalies contour map of the research area.
3.2 Results of Gravity Data Modeling
Residual gravity anomalies data were modeled by inversion using Grablox 1.7 and Bloxer 1.6e with area boundaries adjusted to the research target as shown in Figure 7. The modeled area is located in the discharge area of the groundwater basin at UTM longitude of 303.35 – 323.75 km and UTM latitude of 9172.15 – 9188.92 km, with anomalies data ranging from -23.38 – 3.26 mGal. The obtained result is a 3D model in the subsurface of the Purwokerto-Purbalingga Groundwater Basin area with rock density values ranging from 1.20 – 4.80 g/cm3 as shown in Figure 8. The cross-sections of the model along the trajectories of AB to KL are shown in Figure 9 to Figure 14. The obtained model resembles a basin with an estimated depth of more than 4 km and a density value ranging from 2.10 – 2.55 g/cm3. The range of density values is estimated to originate from the alluvial deposits and other materials that filled the basin for a long time (Bammelen, 1949).
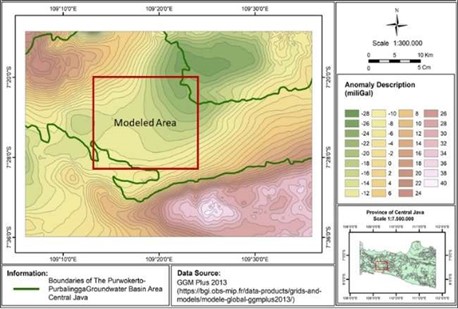
Figure 7: The residual gravity anomalies contour map of the research area; the red lines show area boundaries for inverse modeling.
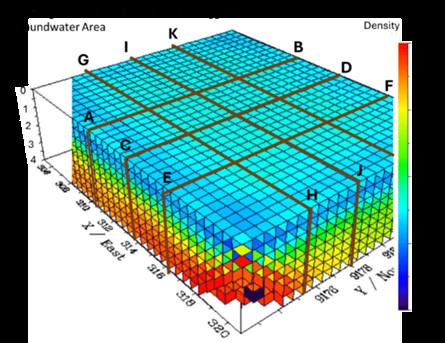
Figure 8: 3D model of subsurface rock density distribution in the Purwokerto-Purbalingga Groundwater Basin area.
Based on Figures 9 to Figure 14, the basin area is dominated by low-density rocks and materials, which are interpreted as alluvial deposits (Yatno et.al., 2016). The alluvial deposits that fill the basin consist of gravel, sand, silt, and clay, which are the result of river and coastal deposits (Asikin and Handoyo, 1992). The alluvial deposits in this basin have received a lot of groundwater supply from the surrounding mountainous and highlands (Ramadhan, 2020). The estimated directions of groundwater flowing into the basin are shown in the figures. The alluvial
deposits are the youngest formation in the research area. This formation occupies the central zone of Java Island, better known as the Serayu Valley. The Serayu Valley is estimated to be a central depression zone that separates the North Serayu Mountains, including Slamet Volcano and the South Serayu Mountains in the central Java Island (Ramadhan, 2020). In this valley, the Serayu River flows towards the Indonesian Ocean (Sartohadi, 2004).

Figure 9:Cross-section of 3D-model along the longitude of 310.38 km-UTM.

Figure 10 :Cross-section of 3D-model along the longitude of 313.40 km-UTM.

Figure 11 :Cross-section of 3D-model along the longitude of 316.43 km-UTM.

Figure 12 :Cross-section of 3D-model along the latitude of 9175.56 km-UTM.

Figure 13 :Cross-section of 3D-model along the latitude of 9178.18 km-UTM.

Figure 14 :Cross-section of 3D-model along the latitude of 9180.80 km-UTM.
3.3 Resistivity Data Support
The results obtained using satellite gravity data have been supported by resistivity data from the geoelectric survey in the groundwater discharge area of Purwokerto-Purbalingga Basin, with the distribution of data shown in Figure 15. The final results of the geoelectric survey is presented in the form of resistivity logs that represent the arrangement of subsurface rocks from surface to bottom. as shown in Figure 16 to Figure 18. The survey gives small resistivity values in almost all research areas, and only a few regions have large values. Overall, the subsurface rock resistivity logs how values within 0.37 – 72.75 m, most of that are interpreted as sand, clayey sand, sandy clay, and gravelly sand. They may originate from river material deposits (Sehah et.al., 2021). The only large river that flows through this basin is the Serayu River. Aquifers that form in the alluvial deposits along watersheds are generally composed of young rock or soil that has not been properly consolidated, such that these rocks or soils are easily occupied and carried by large amounts of groundwater (Echogdali et.al., 2023). A watershed is an area of land that collects rain and snow, where the water flows down to a river, stream, lake, or certain aquifer.
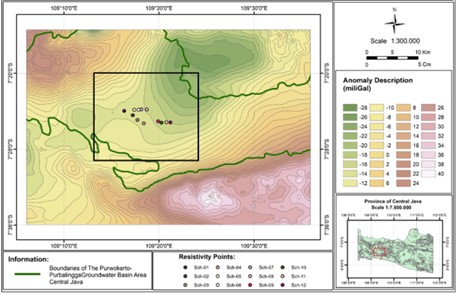
Figure 15 :Distribution of resistivity data in the discharge area of the Purwokerto-Purbalingga Groundwater Basin.
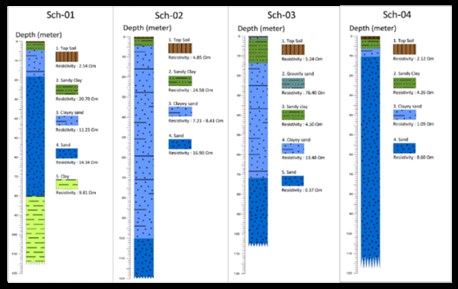
Figure 16 :Resistivity logs of subsurface rocks at sounding points of Sch-01 to Sch-04.
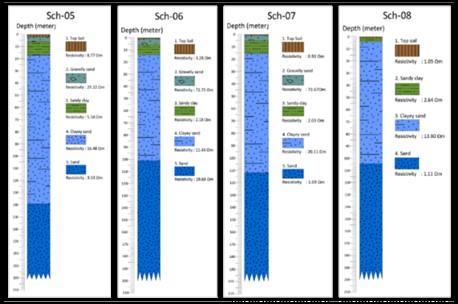
Figure 17 :Resistivity logs of subsurface rocks at sounding points of Sch-05 to Sch-08.
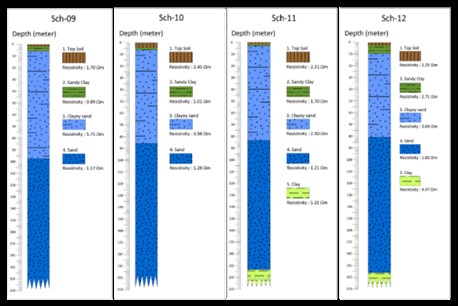
Figure 18 :Resistivity logs of subsurface rocks at sounding points of Sch-09 to Sch-12
The subsurface rock resistivity logs show values within 0.37 – 72.75 m, interpreted as sand to gravelly sand. Based on these results, all types of subsurface rocks in the groundwater discharge area of the Purwokerto-Purbalingga Basin have the potential to store groundwater. All of these rocks are part of the Alluvium Formation (Djuri et.al., 1996). However, the types of rock that are thought to store the most groundwater are sand (0.37 – 19.69 m) and clayey sand (1.09 – 20.11 m). The thickness of the sand cannot be analyzed and interpreted fully, because almost all of these layers are at the bottom of the lithological logs. The modeling and interpretation results of resistivity data are only limited to the alluvial deposits from the Alluvium formation due to the limited depth of the modeling results (Idris et.al., 2022). In this area, the Alluvium Formation is the youngest formation that is still forming today and is estimated to be a place where large amounts of groundwater converge from the surrounding recharge areas (the South Slope of Slamet Volcano and South Serayu Mountains) (Djuri et.al., 1996).
3.4 Geological Data Support
The cross-sections of the subsurface model, as shown in Figure 9 to Figure 14, corresponding to the results of the analysis of the straightness of hills and valleys in this area based on the Shuttle Radar Topography Mission (SRTM) map image and the geological map of the research area (Ramadhan, 2020; Djuri et.al., 1996). Faults and fold axes will represent a morphological arrangement with a unidirectional or parallel orientation in the research area. Hence, based on the straightness patterns obtained from the SRTM image in Figure 19, we can predict the dominant fault direction in the study area in the research area. Based on the analysis of the straightness patterns of hills and valleys on the SRTM map image, the straightness patterns found have two dominant directions, i.e. Northeast – Southwest and Northwest – Southeast (Ramadhan, 2020). The most inclined direction of the straightness patterns is estimated as one of the factors causing the current morphological formation of the research area (forming highlands around and lowlands in the center), resulting in a bowl-like formation. This bowl-like basin acts as a collective saturated space containing various materials, such as sand, gravel, and other porous rocks which are interconnected to form a unified aquifer system, as shown in Figure 9 to Figure 14 (Palma et.al., 2022).
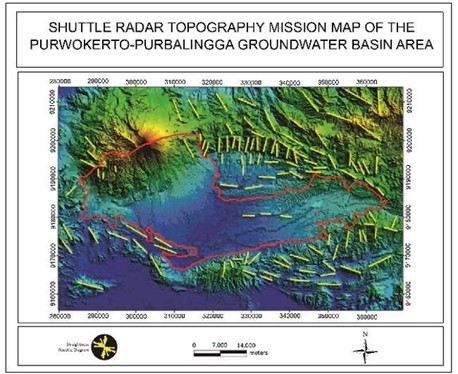
Figure 19 :Resistivity logs of subsurface rocks at sounding points of Sch-09 to Sch-12.
Based on Figure 19, the Purwokerto-Purbalingga Groundwater Basin area has recharge areas on the South Slope of Slamet Volcano and North Serayu and the South Serayu Mountains (Tabrani, 1985). The groundwater flow rate in the recharge area (i.e. the Southern Slope of Slamet Volcano) can reach 2,800 mm per year, while in the discharge area, it only reaches 1,200 mm per year. It shows that the Southern Slope of Slamet Volcano is a recharge area for highly productive aquifers. The lava rocks in the groundwater recharge area of this basin are of the vesicular type, marked by cavities and cracks, allowing groundwater to flow through them (Tabrani, 1985).
In the recharge area, groundwater recharging occurs naturally through surface water infiltration and rainfalls that enter rivers, wetlands, and open spaces. The depth of the water table in the discharge area varies according to topographic elevation, ranging from 0.25 – 16 m (Ramadhan, 2020). The measured dept of the water table are reasonably in accordance with the results of resistivity data modeling obtained in this study. Lithological units that have the potential to contain a large amount of groundwater are clayey sand and sand. Clayey sand begins to be found at a depth of 2.95 – 138.18 m, while sand begins to be found at a depth of 10.48 m down to a depth that could not be detected by geoelectrical survey. Geological information indicates that the alluvial deposits that fill the groundwater basin originate from the Alluvium Formation with a maximum thickness of around 500 m (Djuri et al., 1996). Under the alluvial deposits, old deposits from the Undak Formation with unknown depth exist. Thus, the results of this geophysical modeling are expected to produce new discovery or novelty regarding the subsurface geological structure of the Purwokerto-Purbalingga Basin, although it needs further examination.
3.5 Benefits of Research for the Development of Groundwater-Based Irrigation
The Purwokerto-Purbalingga Groundwater Basin area is fertile agricultural land, especially in the border area of the Banyumas and Purbalingga Regencies. The area is located at the center of the basin, i.e. a groundwater discharge area. The use of groundwater in this basin area as a source of irrigation water for agricultural land has never been carried out. Therefore, efforts to realize a groundwater-based irrigation on agricultural land must be supported by all parties. The expected benefit is increased availability of irrigation water to extend the planting period on rainfed land and dry land due to water shortages during the dry season. The carrying capacity of the Purwokerto-Purbalingga Basin is quite capable of replacing surface water as a source of irrigation water. This is in accordance with the fact that wells in several villages in this area rarely experience drought (Merdeka.com, 2020).
The results of this research can be a strategic step to strengthen Indonesia’s food security. The realization of the groundwater-based irrigation program must be based on the principles of groundwater management based on scientific studies, supported institutionally and legally, and implemented by empowering various stakeholders. Based on the research results, the recommended follow-up action is an exploration of deep groundwater sources using geophysical well-logging techniques in several locations that are estimated to have great potential based on gravity and resistivity data (Kravtsof et.al., 2022). Geophysical well-logging is a technique used to gather data from drilled boreholes. These data are measured by lowering instruments into drill holes and then used to determine lithological units, hydrogeological cross-sections, and groundwater quality. Evaluation of groundwater quality needs to be carried out, especially for the classification of drinking, household and agricultural irrigation water supplies (Olusola, 2020).
4. CONCLUSION
The use of gravimetric satellite data has been carried out for a study of the potential of the Purwokerto-Purbalingga Basin as a source of irrigation water. The gravity anomalies data used in the research was obtained by accessing the GGM plus website with a total of 51,900 data sets, that span geographical positions between 109.0083° – 109.6083° E and 7.2554° – 7.6026° S. This study is also supported by subsurface rock resistivity data. After going through the processing and modeling stages of the gravity anomalies data, the distribution model of the subsurface rock density was obtained with values ranging from 1.20 – 4.80 g/cm3. Based on the obtained model, the basin area which is estimated to contain large amounts of water, is interpreted to be composed of alluvial deposits with density values ranging from 2.10 – 2.55 g/cm3 and a depth of more than 4 km. Resistivity data measured in the groundwater discharge area also supports the presence of the alluvial deposits. The types of subsurface rock interpreted to be quite dominant and store a lot of groundwater are sand (0.37 – 19.69 m) and clayey sand (1.09 – 20.11 m). The results of this study provide an important stage in the development of the Purwokerto-Purbalingga Groundwater Basin as a potential groundwater source for sustainable agricultural irrigation. The recommended follow-up action is an exploration of deep groundwater sources using geophysical well-logging in several locations that are estimated to have great potential based on gravity and resistivity data.
ACKNOWLEDGMENT
The authors would like to express the Rector and Director of the Research and Community Service Institute of Jenderal Soedirman University for the research funding provided. The authors would also like to express gratitude to the members of the research team consisting of Physical students and lecturers from the Geophysical Study Group, Faculty of Mathematics and Natural Sciences, Jenderal Soedirman University for their excellent contribution and collaboration in the research.
REFERENCES
Adamu, A., Likkason, O.K., Maigari, A.S., Ali, S., Yohanna, A., 2022. Interpretation Analysis from Satellite Gravity Data to Image the Upper Lithospheric Patterns and their Hydrocarbon Significance in Sokoto Basin, Nigeria. Bayero Journal of Pure and Applied Sciences, 13 (1), Pp. 455-46. DOI: http://dx.doi.org/10.4314/bajopas.v13i1.69S.
Anonimous, 2015. Application of the Geoelectric Method for Groundwater Exploration. Geophysical Consultant. Website. Accessed from URL: https://seisxploresurvey.wordpress.com/ 2015/03/16/ [Accessed in November 22, 2022].
Asikin, S., Handoyo, A., 1992. Geological Map of The Banyumas Quadrangles, Java, Scale 1:100000. Geological Research and Development Center. Bandung. Indonesia.
Bammelen, R.W.V., 1949. The Geology of Indonesia, Vol. IA: General Geology of Indonesia and Adjacent Archipelagoes. Government Printing Office. The Haque. Pp. 732.
BGI, 2013. GGMplus2013 Global Model. Website. Accessed from URL: https://bgi.obs-mip.fr/data-products/grids-and-models/modele-global-ggmplus2013/ [Accessed in March 1, 2023]
Biswas, A., 2015. Interpretation Of Residual Gravity Anomaly Caused by Simple Shaped Bodies Using Very Fast Simulated Annealing Global Optimization. Geoscience Frontiers, 6, Pp. 875-893. DOI: https://doi.org/10.1016/j.gsf.2015.03.001.
Blakely R.J., 1995. Potential Theory in Gravity and Magnetic Applications. Cambridge University Press. USA. Pp. 464. DOI: https://doi.org/10.1017/CBO9780511549816.
Camacho, M., Alvarez, R., 2021., Geophysical Modeling with Satellite Gravity Data: Eigen-6C4 vs. GGM Plus. Engineering, 13, Pp. 690-706. DOI: https://doi.org/10.4236/eng.2021.1312050.
Condon, W.H., Pardyanto, L., Ketner, K.B., Amin, T.C., Gafoer, S., and Samodra, H., 1996. Geological Map of The Banjarnegara and Pekalongan Quadrangles, Java, Scale 1:100,000. Geological Research and Development Center. Bandung. Indonesia.
Demiroglu, M., 2017. Identifying The Groundwater Basin Boundaries, Using Environmental Isotopes: A Case Study. Applied Water Science, 7, Pp. 1161–1167. DOI: https://doi.org/10.1007/s13201-016-0516-y.
Djuri, M., Samodra, H., Gafoer, S., 1996. Geological Map of The Purwokerto and Tegal Quadrangles, Java, Scale 1:100,000. Geological Research and Development Center. Bandung. Indonesia.
Echogdali, F.Z., Boutaleb, S., El Ayady, H., Aadraoui, M., Abdelrahman, K., Bendarma, A., Ikirri, M., Abu-Alam, T., Id-Belqas, M., Abioui, M., 2023. Characterization and Productivity of Alluvial Aquifers in Sustainability Oasis Areas: A Case Study of the Tata Watershed (Southeast Morocco). Applied Sciences, 13, Pp. 5473. DOI: https://doi.org/10.3390/app13095473.
Handika, S.N., Sehah, 2020. Depth Estimation of the Aquifer Using Geoelectric Technique and It’s Comparison with Drilling Result in Pekuncen Village, Jatilawang District, Banyumas Regency. Jurnal Geologi dan Sumberdaya Mineral (JGSM), 21 (2), Pp. 93-102. DOI: https://doi.org/10.33332/jgsm.geologi.v21i2.478
Idris, S., Syukri, M., Surbakti, M.S., Marwan, Muchlis, Rusydy, I., Aflah, N., 2018. Analysis of Shallow Subsurface Structure at Geothermal Area of IE JUE Using Resistivity Method. Jurnal Natural, 18 (1), Pp. 18-21. DOI: https://doi.org/10.24815/jn.v18i1.9676.
Indrawati, L.D.I., Indriana, R.D., Nurwidyanto, I., 2020. Comparative Results of Regional and Residual Anomalies with the Upward Continuation, Moving Average, and Polynomial Methods for Magnetic Data. Journal of Physics and Its Applications, 2 (2), Pp. 90-93. DOI: https://doi.org/10.14710/jpa.v2i2.7673.
Indriana, R.D., Harmoko, U., Lutfiana, V., Kautsar, M., 2019. Geothermal Area Analysis in the Mt. Batur Area, Bali, Using Landsat-8 and Gravity GGM-Plus Satellite Data. Quest Journals, Journal of Research in Environmental and Earth Sciences, 8 (10), Pp. 21-26.
Kravtsov, Y.V., Babaev, R.A., Kadyrov, M.A., Vaganov, Y.V., Tugushev, O.A., Drugov, D.A., Abdrashitova, R.N., 2022. Evaluation of Reservoir Properties of the Cenomanian Aquifer System at Sites of Produced Water Pumping as Exemplified by the West Salym Oilfield in West Siberia. Water Conservation & Management, 6 (2), Pp. 70-75. DOI: 10.26480/wcm.02.2022.70.75.
Maghfira, P.D., Niasari, S.D., 2019. Gravity satellite data analysis for subsurface modelling in Mount Merapi-Merbabu, Java, Indonesia. Environment, Energy and Earth Sciences (E3S) Web of Conferences. 76, Pp. 03003. DOI: https://doi.org/10.1051/e3sconf/20197603003
Maulana, A.D. and Prasetyo, D.A., 2019. Mathematical Analysis on Bouguer Correction and Field Correction on Topex Satellite Gravity Data and Application in Geohazard; A Case Study of the Palu Koro Fault, Central Sulawesi. Jurnal Geosaintek, 5 (3), Pp. 91-100. DOI: http://dx.doi.org/10.12962/j25023659.v5i3.6100.
Merdeka.com, 2020. Drought, Three Villages in Purbalingga Freshwater Crisis. Edition: August 31, 2020. Website. Accessed from URL: https://www.merdeka.com/peristiwa/kekeringan-tiga-desa-di-purbalingga-krisis-air-bersih.html [Accessed in January 16, 2022].
Mohamed, A., Alshehri, F., 2023. Application of Gravity and Remote Sensing Data to Groundwater Potential in Wadi Ar-Rahmah, Saudi Arabia. Frontiers in Earth Science, 11, Pp. 1-10. DOI: https://doi.org/10.3389/feart.2023.1227691.
Nguyen, V.S., Pham, V.T., Nguyen, L.V., Andersen, O.B., Forsberg R., Bui, D.T., 2020. Marine Gravity Anomaly Mapping for the Gulf of Tonkin Area (Vietnam) Using Cryosat-2 and Saral/Altika Satellite Altimetry Data. Advances in Space Research, 66 (3), Pp. 505-519. DOI: https://doi.org/10.1016/j.asr.2020.04.051.
Olusola, F.O., 2020. Groundwater Quality Evaluation for Drinking, Domestic and Irrigation Uses in Parts of Ode Irele Local Government Area of Ondo State, Nigeria. Water Conservation & Management, 4 (1), Pp. 32-41. DOI: https://doi.org/10.26480/wcm.01.2020.32.41.
Palma, A., Rivera, A., Carmona, R., 2022. A Unified Hydrogeological Conceptual Model of the Mexico Basin Aquifer after a Century of Groundwater Exploitation. Water, 14, Pp. 1584. DOI: https://doi.org/10.3390/w14101584.
Perozzi, L., Guglielmetti, L., Moscariello, A., 2021. Quantitative Uncertainty Analysis of Gravity Disturbance, The Case of the Geneva Basin (Switzerland). Journal of Applied Geophysics, 193, Pp. 104431. DOI: https://doi.org/10.1016/j.jappgeo.2021.104431.
Ramadhan, F., 2020. Geology and Purwokerto-Purbalingga Groundwater Basin Modeling. Bachelor’s Thesis at Dept. of Geological Engineering, Faculty of Engineering, Jenderal Soedirman University Purwokerto, Pp. 68-70.
Sartohadi, J., 2004. Geomorfologi Tanah DAS Serayu Jawa Tengah. Majalah Geografi Indonesia, 18 (2), Pp. 135-150. DOI: https://doi.org/10.22146/mgi.13273.
Sehabuddin, M., Dianto, A., Subehi, L., Irianto, S., 2019. Characteristic Aquifer in Volcanic Terrains: Case Study at Caldera Lake Maninjau, West Sumatera – Indonesia. IOP Conf. Series: Earth and Environmental Science, 311, Pp. 012029. DOI: https://doi.org/10.1088/1755-1315/311/1/012029.
Sehah, Hartono, Irayani, Z., Prabowo, U.N., 2021. Designing Aquifer Model for the Banks of the Serayu River, Sokawera, Somagede, Banyumas, Indonesia by Means of 1D-Electrical Resistivity Data. Jounal of Mathematic and Fundamental Sciences (JMFS), 53 (3), Pp. 344-357. DOI: https://doi.org/10.5614/j.math.fund.sci.2021.53.3.1.
Sehah, Prabowo, U.N, Raharjo, S.A., Ikhwana, A.Z., 2022. Physical Modeling of Magma Chamber of Slamet Volcano by Means of Satellite Gravimetric Data. Communications in Science and Technology, 7 (2), Pp. 160-167. DOI: https://doi.org/10.21924/cst.7.2.2022.1001.
Sehah, Prabowo, U.N, Raharjo, S.A., Kurniati, R., 2023. Utilization of Satellite Gravity Anomaly Data for Two-Dimensional Modeling of Subsurface Structure of Slamet Volcano, Central Java, Indonesia. Malaysian Journal of Geosciences (MJG), 7 (1), Pp. 01-07. DOI: https://doi.org/10.26480/mjg.01.2023.01.07
Setiadi, I., Widodo, J., Nainggolan, T.B., 2021. Geological Interpretation of Offshore Central Sumatra Basin Using Topex Satellite Gravity Data. IOP Conf. Series: Earth and Environmental Science, 944, Pp. 012034. DOI: https://doi.org/10.1088/1755-1315/944/1/012034
Supriyanto, A., Supriyadi, Priyantari, N., Cahyono, B.E., 2021. Correlation Between GGMplus, Topex, and BGI Gravity Data in Volcanic Areas in Java Island. Journal of Physics: Conference Series, 1825, Pp. 012023. DOI: https://doi.org/10.1088/1742-6596/1825/1/012023.
Syafnur, A., Jibran, H., Tonapa, W.D., Sae, A., Nurdin, N.H., 2023. Investigation of Groundwater Aquifer Using Electrical Resistivity Method Wenner-Schlumberger Array Mottoangin Village, Bantimurung District, Maros Regency, 7 (1), Pp. 89-98. DOI: 10.2956/geocelebes.v7/i1.23302.
Tabrani, 1985. Hydrogeological Map of Indonesia of Quadrangles of Pekalongan (Java). Geological Research and Development Center (PSG). Bandung.
Wahab, S., Saibi, H., Mizunaga, H., 2021. Groundwater Aquifer Detection Using the Electrical Resistivity Method at ITO Campus, Kyushu University (Fukuoka, Japan). Geoscience Letters, 8, Pp. 15. DOI: https://doi.org/10.1186/s40562-021-00188-6.
Yanis, M., Marwan, Kamalia, N., 2019. Application of Sattelite Geosat and ERS as an Alternative Method of Measuring Gravity Ground in Hydrocarbon Basin on Timor Island. Majalah Geografi Indonesia, 33 (2), Pp. 64-68. DOI: https://doi.org/10.22146/mgi.50782.
Yatno, E., Sudarsono, Iskandar, Mulyanto, B., 2016. Characteristics of Soils Developed from Alluvium and their Potential for Cocoa Plant Development in East Kolaka Regency, Southeast Sulawesi. Journal of Degraded and Mining Lands Management, 3 (3), Pp. 595-601. DOI: https://doi.org/10.15243/jdmlm.2016.033.595.
Zhao, J., Zeng, Z., Zhou, S., Yan, J., An., B., 2023. 3-D Inversion of Gravity Data of the Central and Eastern Gonghe Basin for Geothermal Exploration. Energies, 16 (5), Pp. 2277. DOI: https://doi.org/10.3390/en16052277.
Zheng, T., Lin, J., Schouten, H., Smith, D.K., Klein, E., Turner, R.P., 2023. Gravity Anomalies and Implications for Shallow Mantle Processes of the Western Cocos-Nazca Spreading Center. Geophysical Research Letters, 50 (5). DOI: https://doi.org/10.1029/2022GL102133.
| Pages | 140-149 |
| Year | 2024 |
| Issue | 2 |
| Volume | 8 |

