
INVESTIGATION OF WATER CONTENT, SOIL DENSITY, HYDRAULIC CONDUCTIVITY AND MATRIX SUCTION ON INFILTRATION RATE IN PADANG CITY – INDONESIA
Journal: Water Conservation and Management (WCM)
Author: Rusli HAR, Syahbudin Hasibuan, Denny Akbar Tanjung, Magdalena Saragih, Rahmad Setia Budi, Muji Paramuji
Print ISSN : 2523-5664
Online ISSN : 2523-5672
This is an open access article distributed under the Creative Commons Attribution License CC BY 4.0, which permits unrestricted use, distribution, and reproduction in any medium, provided the original work is properly cited
Doi: 10.26480/wcm.02.2024.156.163
Abstract
 Floods and soil erosion are slow processes of water absorption. One reason is the physical properties of the soil. This research aims to determine the effect of water content, soil density, hydraulic conductivity, and suction matrix on the infiltration rate in Padang City, Indonesia. This research uses the Kostiakov method. The research area is divided into six watersheds, namely the Batang Arau, Timbalum, Sungai Pisang, Batang Kuranji, Batang Air Winter Watershed, and Batang Kandis watersheds. Carried out in October–December 2022. Test results were processed using simple regression analysis using the IBM version of SPSS Analysis of Variance (ANOVA). Analysis shows that the infiltration rate decreases with increasing water content and soil density. For every 1% increase in water content, the infiltration rate decreases by 0.127 cm/minute, and for every 1 g/cm3 increase in soil density, the infiltration rate decreases by 2.848 cm/minute. Meanwhile, the infiltration rate increases with increasing hydraulic conductivity and matrix suction. Every increase in the hydraulic conductivity value by 1 cm/second will increase the infiltration rate by 27.732 cm/minute, and every increase in the suction matrix value by 1 CB will increase the infiltration rate by 0.006 cm/minute.
Keywords
Flood, Soil Erosion, Water Absorption, Watersheds
1. INTRODUCTION
Infiltration is the process by which rainwater seeps into the soil by capillary action and gravity, thereby penetrating the soil. This incoming water penetrates the soil through soil cracks, pores, and rocks. The water that seeps in, unable to return to the atmosphere through evaporation, becomes groundwater, which flows into a nearby river (Sun et al., 2022). Rainwater that seeps into the soil system is categorized as an unsaturated zone or hydrogeologically categorized as an unconfined aquifer zone (Science, 2023; Nageswara Rao et al., 2022).
The ability to absorb rainwater that is highest in certain soil types is referred to as infiltration capacity. This quantity of water that seeps generally occurs when the intensity of rain exceeds the soil’s ability to absorb moisture (Har et al., 2024). The pace of water absorption by the soil will, however, be parallel to the rate of rainfall if the intensity of the rain is lower than the amount that the soil can hold (Saravanan et al., 2022).
The infiltration water rate is influenced by several factors, as has been shown in previous studies, where land use (the variable that most influences soil structure) has a large impact on water infiltration. There is a significant correlation between infiltration rate and soil structural properties (such as bulk density, wet aggregate stability, average diameter weight, organic carbon, and porosity), indicating a positive effect of soil structure improvement on water infiltration (Ma et al., 2023). Infiltration rate is affected by evaporation from infiltration pits in the process of using appropriate precipitation to recharge groundwater in dry and semi-arid rainfed agricultural areas (Zhang et al., 2023).
Cracked soil surface can affect the crack preheating time, which increases with increasing surface crack ratio and number of cracks, while the rate of change decreases with an increasing number of drying-wetting cycles (Cheng et al., 2021). According to another study, soil water content (SWC) and root volume percentage (PV) during the infiltration process affect the rate of soil infiltration (Cui et al., 2019).
Litter-covered biocrust can increase soil infiltration and help rainfall replenish soil water content in the lower topsoil (0–10 cm depth) (Cui et al., 2021). Meanwhile, by adding a 2:1-type CaCl2 electrolyte, the concentration of groundwater movement can affect the infiltration rate (10−2 mol L-1) (Zhang et al., 2019). Additionally, previous studies have shown that compacted soil has a much greater yield than uncompacted soil; this difference is most pronounced near the surface in the infiltration rate (Halvorson et al., 2003).
Studies show that rainfall can affect the surface roughness of sandy loam soils. Surface roughness increases after the soil particles shift due to raindrops, whereas on a rougher surface, the surface roughness decreases after rain because raindrops descending the slope and destroying the soil aggregates generate kinetic energy (Bahddou et al., 2023). If high rainfall and low infiltration rates inhibit the entry of water into the soil, this can cause flooding. In some cases, in other areas, the water content, soil density, hydraulic conductivity, and succi matrix can affect the infiltration rate.
The authors aimed to examine how infiltration rates in Padang City, Indonesia, were affected by water content, soil density, hydraulic conductivity, and matrix suction based on the rationale provided above.The amount of rainwater that is absorbed through infiltration and percolation processes into the zone will become a groundwater reserve to meet the clean water needs of the community and agricultural needs. Therefore, it is important to conduct a study to look at the factors that influence the value of infiltration in the city of Padang. By knowing the magnitude of the values of the factors that influence infiltration, steps can be taken to conserve soil and groundwater in the study area.
2. MATERIAL AND METHODS
2.1 Study Area
This study was conducted in the city of Padang in West Sumatra Province, Indonesia, which is geographically located between 0°44’00” and 1°08’35” South Latitude and 100°05’05” and 100°34’09” East Longitude. Following the provisions of Government Regulation No. 17 of 1980, the area of the City of Padang covers an area of 694.96 square kilometers, with the majority of its area (around 69.33%) being above an altitude of 250 meters above sea level. More than 60% of the area of Padang City, approximately 434.63 km2, consists of mountainous areas covered by conservation forests and agricultural areas. Meanwhile, the remaining 260.33 km2 is an active urban area. This research was conducted in October-December 2022. The research area is divided into six watersheds, namely the Batang Arau, Timbalum, Pisang River, Batang Kuranji, Batang Air Cold, and Batang Kandis watersheds.
2.2 Infiltration Test
This study uses the method of with the consideration that this equation is an empirical equation that assumes that the rate of decrease of water absorbed into the soil until it reaches the final infiltration rate refers to the power function (Xiong et al., 2023; Kostiakov, 1932).
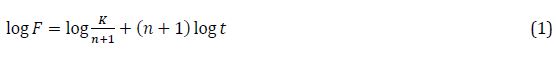
The Kostiakov equation is influenced by two main factors, namely the land factor and the initial soil water content. These factors can be determined from measured infiltration data for various types of soil over a certain period. The Kostiakov method equation can be seen in Equation (1).
2.3 Water Content Test
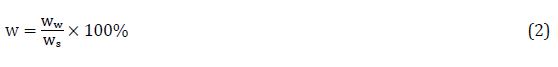
For the analysis of water content (w), it can be done by taking the percentage ratio between the wet weight (Ww) and the dry weight (Ws) as shown in Equation (2).
2.4 Soil Density Test
Testing soil density with the Sand Cone method is one way to check soil density figures in the field. The soil tested is soil that has undergone a process of compaction, both naturally and as a result of mechanical activity. The density of soil in the field referred to here is the dry weight per unit volume. The density testing process in the field uses Ottawa sand as a parameter of soil density which, has the following properties: dry, clean, hard, and has no binder, so it can flow freely. The Ottawa sand used is passed through filter no. 10 and retained in sieve no. 200. This method is limited to topsoil, which is between 10 and 15 cm. The equation for determining the density of field soil can be seen in Equations (3-6) (Capowiez et al., 2021).
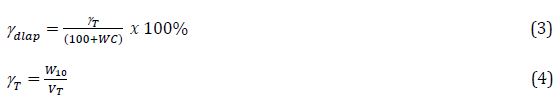
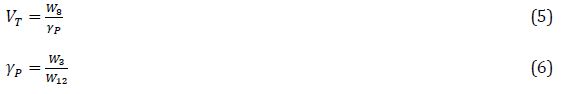
where: _dlap dlap is the density of the soil in the field, _T the bulk density of the excavated soil (original soil density), WC soil water content, V_T volume of the dug hole, γ_P the weight of the sand content, W_12 the weight of the water in the tube, W_10 the weight of the sand in the hole excavated, W_8 the weight of the excavated soil, W_3 the weight of the sand in the tube.
2.5 Hydraulic Conductivity Test
To test the value of hydraulic conductivity in the field, insert a 4-inch-diameter measuring tube into the borehole to the desired depth. After that, saturate the zone to be measured. If the condition of the soil in the drilled hole is saturated, then carry out a hydraulic conductivity test at certain intervals. The hydraulic conductivity data collection method can be carried out using the falling head or constant head method, depending on the soil conditions being measured. The standard used for measuring hydraulic conductivity is ASTM D 508, concerning the measurement of hydraulic conductivity in the field (Latorre and Moret-Fernández, 2019).
If the soil layer has fine grains, the lithology is dominated by clay, and the decrease in the water level in the test tube is very slow, then the falling head method will be used, and the data analysis will use Equation (7).
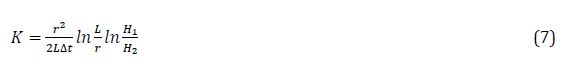
where: L/r ratio > 8, K is saturated hydraulic conductivity (cm/sec), r casing pipe radius (cm), L thickness of soil layer tested (cm), H1 initial groundwater level (cm), H2 height final groundwater level (cm), Δt time required from H1 to H2 (seconds), X height of casing pipe from ground level (cm).
2.6 Matric Suction Test
In the context of two-phase flow compiled a flow equation for the unsaturated zone (where there is water and air) provided that the hydraulic conductivity is a function of the matrix suction, K = K(ψ). Mathematically, the Richards equation can be written in the form of Equation (8).
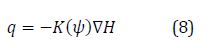
Where ∇H is the hydraulic gradient including the suction and gravity components, K is the saturated hydraulic conductivity, and ψ Matric suction. The negative sign indicates that the tension head, in this case, is the matrix suction, in the opposite direction to the pressure.
To obtain the matric suction value in the study area, the researchers carried out in-situ measurements using a 40 cm-long Hidratal 1000 tensiometer model. To get the matrix suction value at each measured point, a tensiometer tube filled with water is inserted into the soil (Fathipour et al., 2022).
3. RESULTS
3.1 Effect of Moisture Content on Infiltration Rate in Padang City
In order to determine the closeness of the relationship and the influence of the moisture content variable on the infiltration rate in the Padang City area, a regression analysis was performed between the moisture content variable as the independent variable and the value of the infiltration rate as the dependent variable. Based on the output of the SPSS analysis results as shown in Table 1, it is known that the highest R-Square (R2) value occurs in the exponential and logistic regression models at 0.938 and the correlation coefficient (R) at 0.969. A correlation value close to 1 means that the relationship between the two variables is very close. The logistic regression model has a greater regression coefficient than the exponential model, which is equal to 1.135 but is positive. Meanwhile, theoretically, the relationship between water content and infiltration rate is negatively related (Thierfelder and Wall, 2009; Hemmat et al., 2007) .
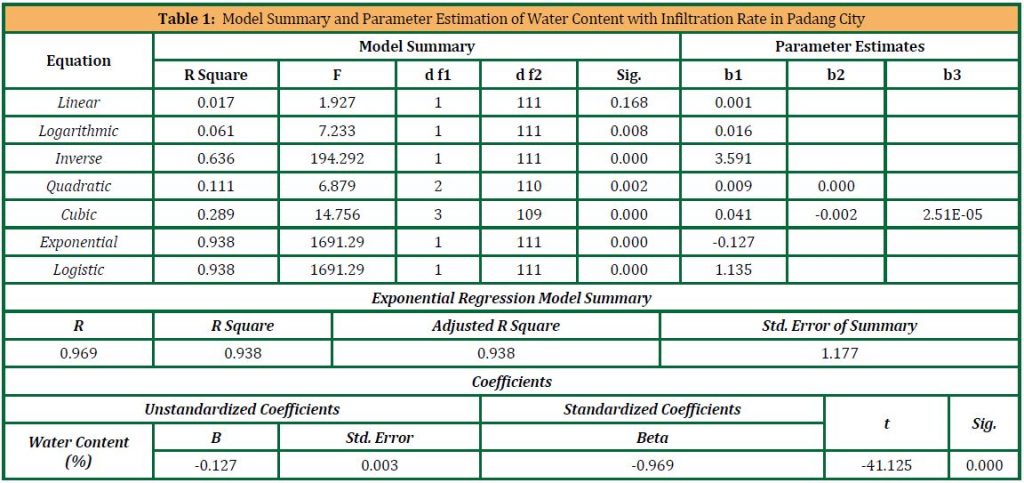
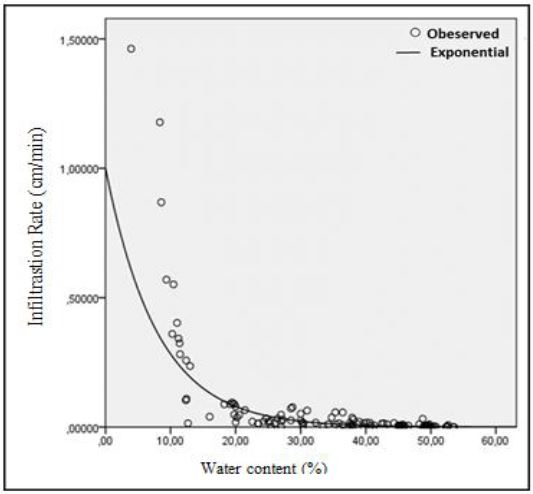
Thus, the non-linear regression model used is the exponential regression model, with a negative sign of the regression coefficient of -0.127 and a significance value of 0.000 <(0.05). This means that the water content has a negative and significant relationship to the infiltration rate. The graph that explains the relationship between water content and infiltration rate in the city of Padang can be seen in Figure 1.
In order to predict the infiltration rate value based on the variable water content in the study region, exponential merchandise can be set up as follows: Ln (Y) = -0.127 X, where Y is the infiltration variable (f) and X is the content variable (water, (θ)). Thus, the form of the exponential regression equation can be arranged as in equation : Ln Infiltration rate (f) = – 0.127 Water content (θ).
Based on Table 2 and Figure 1, it is known that the regression coefficient (B) is -0.127, meaning that for every 1% increase in water content, the infiltration rate in Padang City will decrease by 0.127 cm/minute.
From the results of the significance test, it is known that the t statistic value is -41.125 < -t table (-1.96) or a significance value of 0.000 <α (0.05), so it can be said that the water content has a negative and significant effect on the infiltration rate in Padang City, with the contribution of water content to the decrease in the value of the infiltration being is 93.8%.
3.2 Effect of Soil Density on Infiltration Rate in Padang City.
A regression analysis between the soil density variable as the independent variable and the infiltration rate value as the dependent variable was carried out to ascertain the degree of the association and the influence of soil density variables on infiltration rates in the Padang City region.
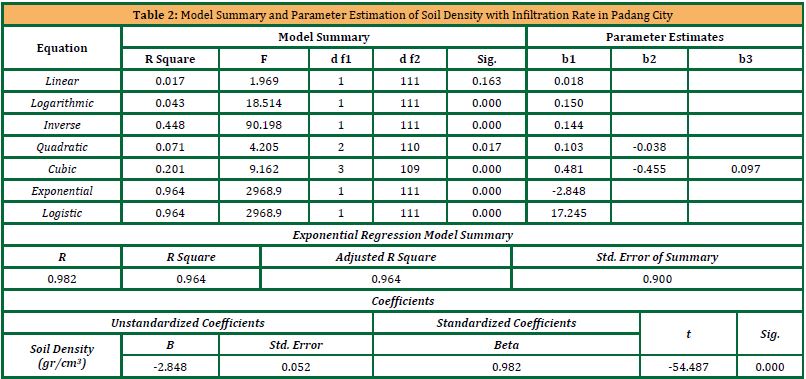
Based on Table 2, it can be seen that the highest R-Square (R2) value occurs in the exponential and logistic regression models, which are 0.964 and 0.982, respectively. A correlation value close to 1 means that the relationship between the two variables is very strong. When viewed from the regression model, the logistic regression model has a regression coefficient (b1) greater than the exponential regression model, which is equal to 17.245 but is positive. Meanwhile, theoretically, the relationship between soil density and infiltration rate is negatively related.
Thus, the non-linear regression model that is more appropriate to use is the exponential regression model with a regression coefficient (b1) with a negative sign of -2.848 and a significance value of 0.000 <0.05. This means that soil density has a negative and significant relationship to the infiltration rate. The graph of the relationship between soil density and infiltration rate in Padang City can be seen in Figure 2.
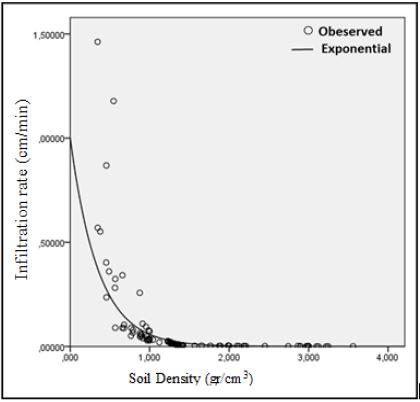
The results of the regression analysis above, an exponential equation can be constructed to predict the infiltration rate value based on the soil density variable in the study area in the form: Ln (Y) = -2.848 X, where Y is the infiltration variable (f) and X is the soil density variable (ɣ). Thus, the form of the exponential regression equation can be arranged as in Equation: Ln Infiltrasi (f) = -2.848 Kepadatan Tanah (ɣ).
The graphic plot in Figure 2 shows that the trend of the relationship pattern between soil density and infiltration rate is decreasing sharply. This means that an increase in the value of soil density will be followed by a decrease in the value of the infiltration rate. The strength of the relationship between the two variables mentioned above can be seen in Table 3. Where there is a close relationship between soil density and infiltration rate in the study area, it has a correlation coefficient (R) of 0.982. On the other hand, the value of the regression coefficient (B) is -2.848, meaning that for every increase in soil density of 1 g/cm3, the value of the infiltration rate in the study area will decrease by 2.848 cm/minute.
From the results of the significance test, it is known that the t statistic value is -54.487 <- t table (-1.96) or a significance value of 0.000 <α (0.05). It can be said that soil density has a negative and significant effect on the infiltration rate in the area of research, with the contribution of soil density to the decrease in the value of the infiltration rate of 96.4% (Junhao et al., 2022; Xie et al., 2020).
3.3 Effect of Hydraulic Conductivity on Infiltration Rate in Padang City
A regression analysis between the hydraulic conductivity variable as the independent variable and the infiltration rate value as the dependent variable was carried out to ascertain the strength of the relationship and the influence of the hydraulic conductivity variable on the infiltration rate in the Padang City area.
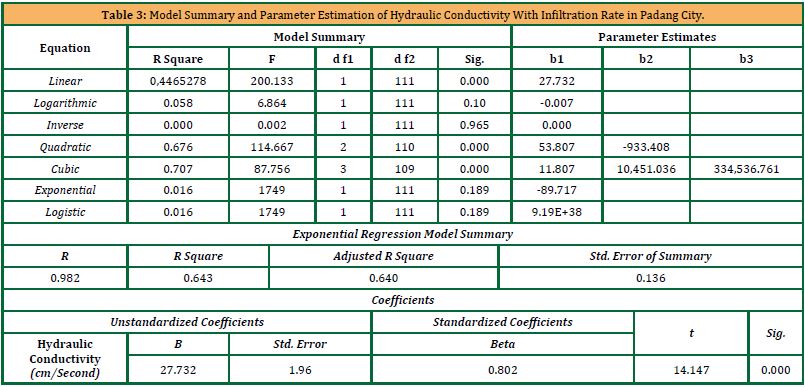
According to Table 3, the cubic regression model has the greatest R-Square (R2) value, which is equal to 0.707, and the correlation coefficient (R), which is equal to 0.841. This model is followed by the quadratic and linear regression models.The cubic regression model has a smaller regression coefficient (b1) than the quadratic model, which is 11.807 and is positive. However, there is a regression coefficient value with a negative sign on the b3 parameter value.
Based on these considerations, a more suitable regression model is a linear model with a positive regression coefficient (b1) of 27.732 and a significance value of 0.000 <0.05. This indicates a considerable and positive association between the hydraulic conductivity and infiltration rate, with an R-square (R2) value of 0.643 and a correlation coefficient (R) of 0.802. A correlation number that is close to 1 means that the relationship between the two variables is very close. The graphical plot of the relationship between hydraulic conductivity and infiltration rate can be seen in Figure 3.
From the results of the regression analysis above, a linear equation can be developed to predict the value of the infiltration rate based on the hydraulic conductivity variable in the study area in the form: Y = 27.732 X, where Y is the infiltration variable (f) and X is the hydraulic conductivity variable (K).
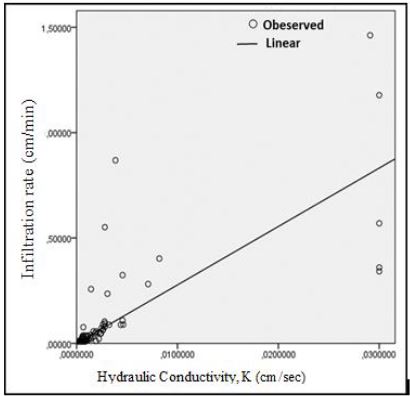
Thus, the form of the linear regression equation in Figure 4 can be arranged as in Equation: Infiltration rate (f) = 27.732 hidraulic conductivity (K). The graphic plot in Figure 3 above shows that the trend of the relationship pattern of hydraulic conductivity to infiltration rate is linear. That is, every increase in the value of soil density will be followed by a linear increase in the value of the infiltration rate. The regression coefficient (B) is 27.732, meaning that for every 1 cm/second increase in the hydraulic conductivity value, the infiltration rate in the study area will increase by 27.732 cm/minute.
From the results of the significance test, it is known that the t statistic value is 14.147 > t table (1.96) or a significance value of 0.000 < α (0.05). Then the hydraulic conductivity has a positive and significant effect on the infiltration rate in the study area, with increased hydraulic conductivity contributing to the value of the infiltration rate of 64.3%. The same results have been reported by previous studies (Biddoccu et al., 2013).
3.4 Effect of Matric Suction on Infiltration Rate in Padang City.
To find out the closeness of the relationship and the influence of the matrix suction variable on the infiltration rate in the Padang City area, a regression analysis was performed between the matrix suction variable as the independent variable and the value of the infiltration rate as the dependent variable, as shown in Table 4.
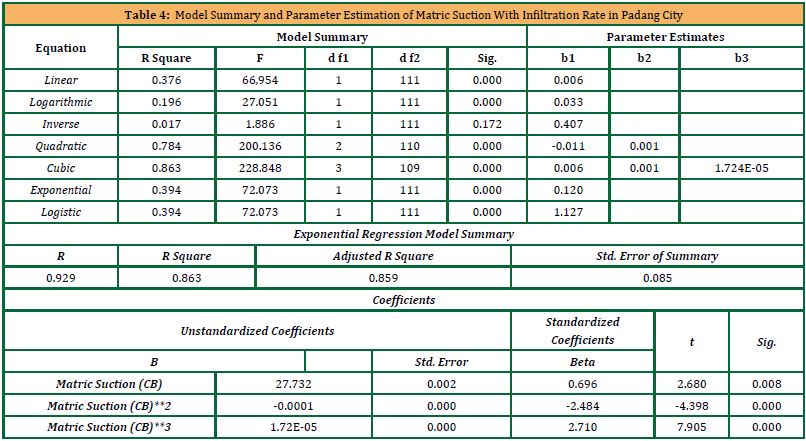
Based on Table 4, the SPSS output results show that the highest R-Square (R2) value occurs in the cubic regression model, which is equal to 0.863. The cubic regression model has a smaller regression coefficient than the quadratic regression model, which is equal to 0.006 and is positive. But in this quadratic regression model, the regression coefficient (b2) is negative at -0.001. This value is very small when compared to other parameter values, so this model is not suitable for predicting the effect of matrix suction on the infiltration rate.
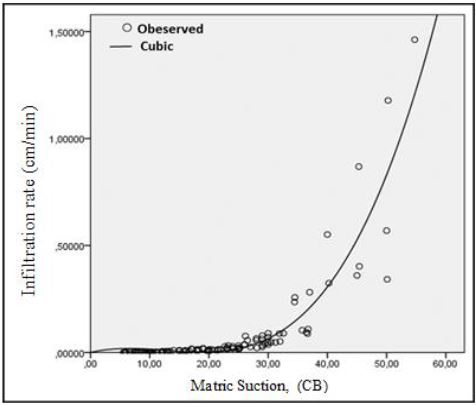
Thus, the non-linear regression model that is more suitable to use is the cubic regression model with a positive sign of the regression coefficient of 0.006 and a significance value of 0.000 <0.05. This means that matrix suction has a positive and significant relationship to the infiltration rate, where the R-Square (R2) value is 0.863 and the correlation coefficient (R) is 0.929. A correlation number that is close to 1 means that the relationship between the two variables is very close. The graphic plot of the relationship between matrix suction and infiltration rate can be seen in Figure 4.
From the results of the regression analysis in Table 5, a cubic model regression equation can be developed to predict the value of the infiltration rate based on the suction matrix variable in the study area in the form: Y = 0.006 X – 0.001 X2 + 1.724E-05 X3, where Y is the infiltration variable (f) and X is the suction matrix variable (ψ). Thus, the form of the cubic regression equation can be arranged as in Equation 9.
Infiltration rate = 0,006 Matric Suction -0,001 Matric Suction 2 + 1,724E-05 Matric Suction 3 (9)
The graphic plot in Figure 5 above shows that the trend of the relationship between matrix suction and infiltration rate is increasing. An increase in the value of the matrix suction will be followed by an increase in the value of the infiltration rate in the study area. In Table 4, it can be seen that the regression coefficient (B) is 0.006. This means that for every increase in the matrix suction value of 1 CB, the value of the infiltration rate in the study area will also increase by 0.006 cm/minute. From the results of the significance test, it is known that the t statistic value is 2.680 > t table (1.96) or a significance value of 0.008 <α (0.05). This means that the matrix suction has a positive and significant effect on the value of the infiltration rate in the study area, with an increase in the contribution of the matrix suction to the value of the infiltration rate of 86.3% (Esmaili et al., 2014).
4. DISCUSSION
The effect of water content on the value of the infiltration rate in the city of Padang shows a negative and significant relationship at a level of 95% with a regression coefficient (b1) of -0.127. That is, the higher the water content in Padang City, the smaller the value of the infiltration rate. In other words, for every 1% increase in water content, the infiltration rate in Padang City will decrease by 0.127 cm/minute.Many factors influence this, such as rainfall density, wet aggregate stability, average diameter weight, organic carbon, and porosity (Ma et al., 2023). Further investigation is needed to find the answer.
The effect of soil density on the value of the infiltration rate in the city of Padang also shows a negative and significant relationship at a level of 95% with a regression coefficient (b1) of -2.848. That is, the higher the soil density in Padang City, the smaller the value of the infiltration rate will be. In other words, for every 1 g/cm3 increase in soil density, the infiltration rate value in Padang City will decrease by 2.848 cm/minute. As is known, the City of Padang consists of 7 types of soil, the widest being latosol with an area of 32,453.15 ha and alluvial with an area of 15,948.07 ha (BAPPEDA, 2012). Litosol has a thick soil solution, an average organic matter of 5%, moderate to high nutrient elements, and a generally clay texture.
The effect of hydraulic conductivity on the value of the infiltration rate in the city of Padang shows a positive and significant relationship at a level of 95% with a regression coefficient (b1) of 27.732. That is, the higher the hydraulic conductivity of the soil in Padang City, the greater the value of the infiltration rate. In other words, for every 1 cm/second increase in the value of hydraulic conductivity, the value of the infiltration rate in Padang City will increase by 27.732 cm/minute. The increased movement of water in the soil is influenced by the physical properties of the soil, such as bulk density, specific gravity, porosity, and soil texture (Rosyidah and Wirosoedarmo, 2013).
The effect of matric suction on the value of the infiltration rate in Padang City also shows a positive and significant relationship at the 95% level with a regression coefficient (b1) of 0.006. That is, the higher the metric suction value in the soil in Padang City, the higher the value of the infiltration rate will be. In other words, for every increase in the value of the suction matrix by 1 CB, the value of the infiltration rate in Padang City will also increase by 0.006 cm/minute (Zulvi and Rusli, 2018).
5. CONCLUSION
The infiltration rate in Padang City is influenced by water content, soil density, hydraulic conductivity, and suction matrix. The hydraulic conductivity and the suction matrix increase as the infiltration rate increases. Conversely, the infiltration rate decreases with increasing water content and density. The slow rate of infiltration can cause the water to stagnate when it rains. Testing needs to be carried out for other sub-districts in Padang City so that sampling from each area can be represented.
AUTHOR CONTRIBUTIONS
Rusli Har : Conceptualization, Methodology, Data curation, Formal analysis, Supervision, Project administration.; Syahbudin Hasibuan : Writing-review, Writing-original draft and editing, final article.; Denny Akbar Tanjung and Magdalena Saragih : Project administration, Background of research, final analysis, Correcting writing errors, Visualization; Rahmad Setia Budi and Muji Paramuji : Conclusion, Background of research, Literature review,
REFERENCES
Bahddou, S., Otten, W., Whalley, W. R., Shin, H.-C., El Gharous, M., and Rickson, R. J., 2023. Changes in soil surface properties under simulated rainfall and the effect of surface roughness on runoff, infiltration and soil loss. Geoderma, 431, Pp. 116341. https://doi.org/10.1016/j.geoderma.2023.116341
BAPPEDA. 2012. RPJPD Kota Padang Tahun 2005-2025.
Biddoccu, M., Ferraris, S., Cavallo, E., Opsi, F., Previati, M., and Canone, D., 2013. Hillslope Vineyard Rainfall-Runoff Measurements in Relation to Soil Infiltration and Water Content. Procedia Environmental Sciences, 19, Pp. 351–360. https://doi.org/10.1016/j.proenv.2013.06.040
Capowiez, Y., Sammartino, S., Keller, T., and Bottinelli, N., 2021. Decreased burrowing activity of endogeic earthworms and effects on water infiltration in response to an increase in soil bulk density. Pedobiologia, Pp. 85–86, 150728. https://doi.org/10.1016/j.pedobi.2021.150728
Cheng, Q., Tang, C. S., Xu, D., Zeng, H., and Shi, B., 2021. Water infiltration in a cracked soil considering effect of drying-wetting cycles. Journal of Hydrology, 593(October), 125640. https://doi.org/10.1016/j.jhydrol.2020.125640
Cui, Z., Huang, Z., Luo, J., Qiu, K., López-Vicente, M., and Wu, G. L., 2021. Litter cover breaks soil water repellency of biocrusts, enhancing initial soil water infiltration and content in a semi-arid sandy land. Agricultural Water Management, 255(February), Pp. 1–6. https://doi.org/10.1016/j.agwat.2021.107009
Cui, Z., Wu, G. L., Huang, Z., and Liu, Y., 2019. Fine roots determine soil infiltration potential than soil water content in semi-arid grassland soils. Journal of Hydrology, 578(26), 124023. https://doi.org/10.1016/j.jhydrol.2019.124023
Esmaili, D., Hatami, K., and Miller, G. A., 2014. Influence of matric suction on geotextile reinforcement-marginal soil interface strength. Geotextiles and Geomembranes, 42(2), Pp. 139–153. https://doi.org/10.1016/j.geotexmem.2014.01.005
Fathipour, H., Bahmani Tajani, S., Payan, M., Jamshidi Chenari, R., and Senetakis, K., 2022. Influence of transient flow during infiltration and isotropic/anisotropic matric suction on the passive/active lateral earth pressures of partially saturated soils. Engineering Geology, Pp. 310, 106883. https://doi.org/10.1016/j.enggeo.2022.106883
Halvorson, J. J., Gatto, L. W., and McCool, D. K., 2003. Overwinter changes to near-surface bulk density, penetration resistance and infiltration rates in compacted soil. Journal of Terramechanics, 40(1), Pp. 1–24. https://doi.org/10.1016/S0022-4898(03)00014-4
Har, R., Berd, I., Hutasoit, L. M., Tanjung, D. A., and Hasibuan, S., 2024. Water Conservation and Management ( WCM ) Test The Anions And Cations Of Water Using The Piper Trilinear. 8(1), Pp. 24–30. https://doi.org/10.26480/wcm.01.2024.24.30
Hemmat, A., Ahmadi, I., and Masoumi, A., 2007. Water infiltration and clod size distribution as influenced by ploughshare type, soil water content and ploughing depth. Biosystems Engineering, 97(2), Pp. 257–266. https://doi.org/10.1016/j.biosystemseng.2007.02.010
Junhao, C., Pengpeng, C., Xiaodong, G., Qifang, Z., Yunjie, F., Xiaobo, G., Xining, Z., and Yuannong, L., 2022. Effects of plastic film residue and emitter flow rate on soil water infiltration and redistribution under different initial moisture content and dry bulk density. Science of The Total Environment, 807, 151381. https://doi.org/10.1016/j.scitotenv.2021.151381
Latorre, B., and Moret-Fernández, D., 2019. Simultaneous estimation of the soil hydraulic conductivity and the van Genuchten water retention parameters from an upward infiltration experiment. Journal of Hydrology, 572, Pp. 461–469. https://doi.org/10.1016/j.jhydrol.2019.03.011
Ma, S., Ma, M., Huang, Z., Hu, Y., and Shao, Y., 2023. Research on the improvement of rainfall infiltration behavior of expansive soil slope by the protection of polymer waterproof coating. Soils and Foundations, 63(3). https://doi.org/10.1016/j.sandf.2023.101299
Nageswara Rao, D., Bhaskara Rao, T., and Machiraju, P. V. S., 2022. Evaluation of Metal and Bacterial Contamination of Ground Waters in Agriculture and Aquaculture Activity Areas of West Godavari District. Rasayan Journal of Chemistry, 15(3), Pp. 1626–1633. https://doi.org/10.31788/RJC.2022.1536617
Rosyidah, E., and Wirosoedarmo, R., 2013. Pengaruh Sifat Fisik Tanah Pada Konduktivitas Hidrolik. Agritech, 33(3), Pp. 340–345.
Saravanan, A. M., Patil, G. N., Mohammed, Z. H., Walke, S. M., and Achuthan, M., 2022.Experimental Studies and Analysis on the Treatment of Groundwater Using Solar and Wind Energy. Rasayan Journal of Chemistry, 15(3), Pp. 1876–1881. https://doi.org/10.31788/RJ C.2022.1536955
Science, E., 2023. The Impact of Land Use Change on Surface Runoff at Air Dingin Sub-watershed , Padang City Indonesia The impact of land use change on surface runoff at Air Dingin Sub-watershed , Padang City Indonesia. IOP Conference Series: Earth and Environmental Science, 1160, Pp. 0–10. https://doi.org/10.1088/1755-1315/1160 /1/012027
Sun, F., Xiao, B., and Kidron, G. J., 2022. Towards the influences of three types of biocrusts on soil water in drylands: Insights from horizontal infiltration and soil water retention. Geoderma, 428(26), Pp. 116136. https://doi.org/10.1016/j.geoderma.2022.116136
Thierfelder, C., and Wall, P. C., 2009. Effects of conservation agriculture techniques on infiltration and soil water content in Zambia and Zimbabwe. Soil and Tillage Research, 105(2), Pp. 217–227. https://doi.org/10.1016/j.still.2009.07.007
Xie, C., Cai, S., Yu, B., Yan, L., Liang, A., and Che, S., 2020. The effects of tree root density on water infiltration in urban soil based on a Ground Penetrating Radar in Shanghai, China. Urban Forestry and Urban Greening, 50, 126648. https://doi.org/10.1016/j.ufug.2020.126648
Xiong, G., Zhu, X., Zhang, H., Jiang, J., Yang, Y., Wu, J., and Wu, J., 2023. Barometric pressure variation alters electrical resistivity during water infiltration in the vadose zone. Journal of Hydrology, Pp. 129706. https://doi.org/10.1016/j.jhydrol.2023.129706
Zhang, R., Tian, R., Zhu, L., Yu, Z., Bo Feng, D. L., and Li, H., 2019. Water infiltration under different CaCl2 concentrations for soil with mainly permanent charges. Soil and Tillage Research, 195(September). https://doi.org/10.1016/j.still.2019.104416
Zhang, X., Wang, K., Duan, C., Li, G., Zhen, Q., and Zheng, J., 2023. Evaporation effect of infiltration hole and its comparison with mulching. Agricultural Water Management, 275(November 2022), Pp. 108049. https://doi.org/10.1016/j.agwat.2022.108049
Zulvi, Y. Y., and Rusli, H. A. R., 2018. Kajian Laju Infiltrasi Akhir pada Daerah Aliran Sungai (DAS) Batang Arau Kota Padang Ditinjau dari Perbedaan Litologi, Tata Guna Lahan, dan Sifat Fisik Tanah. Bina Tambang, 3(3), Pp. 1067–1077. http://ejournal.unp.ac.id/index.php/mining/article/ view/101432
| Pages | 156-163 |
| Year | 2024 |
| Issue | 2 |
| Volume | 8 |
