
DROUGHT ASSESSMENT UNVEILED: INTEGRATING REAL DATA AND REMOTE SENSING TECHNIQUES FOR PRECISION EVALUATION FOR THE LAST 3 DECADES IN AMMAN ZARQA BASIN- JORDAN
Journal: Water Conservation and Management (WCM)
Author: Alsharifa Hind Mohammad, Taleb Odeh, Thair Al-Momani and Khaldoun Shatanawi
Print ISSN : 2523-5664
Online ISSN : 2523-5672
This is an open access article distributed under the Creative Commons Attribution License CC BY 4.0, which permits unrestricted use, distribution, and reproduction in any medium, provided the original work is properly cited
Doi: 10.26480/wcm.02.2024.234.240
Abstract
 This article comprehensively evaluates drought situations in the Amman Zarqa Basin (AZB), Jordan, over the past three decades by integrating real data and remote sensing techniques. Drought is a significant environmental challenge in arid and semi-arid regions like Jordan, affecting water resources, agriculture, and socio-economic well-being. By incorporating real-world meteorological and hydrological data, such as the Standardized Precipitation Index (SPI) and standardized Water Index (SWI), with remote sensing-derived indices, such as the Normalized Difference Vegetation Index (NDVI) and Normalized Difference Moisture Index (NDMI), this study presents a detailed evaluation of drought event and spatial distribution in the AZB. SPI maps reveal severe to extreme drought events in specific years, while SWI analysis indicates variations in soil moisture conditions over time. NDVI and NDMI analyses highlight fluctuations in vegetation health and moisture content, reflecting the impact of drought on ecosystem resilience. The results highlight the significance of combining actual data and remote sensing techniques for accurate drought assessment, enabling decision-making and adaptation strategies in water-stressed regions. Through this interdisciplinary approach, policymakers, water managers, and stakeholders can sufficiently understand and address the complex challenges resulting from drought, enhancing the resilience and sustainability of water resources in Jordan and similar regions worldwide.
Keywords
Drought, remote sensing, resilience, AZB.
1. INTRODUCTION
Droughts could be defined as long periods of abnormally low precipitation and increasing in temperature which leading to water scarcity, have become a critical concern, especially in an area characterized by notable climate variability and change. These meteorological phenomena disrupt ecosystems and impact various environmental elements, water resources, agriculture, and diverse socio-economic sectors, affecting millions globally. Accurate assessment and monitoring of drought events are required for decision-making, mitigation measures, and the allocation of resources to manage their consequences (Padrón, et al., 2020; Takeshima, et al., 2020).
Drought indices have played an essential role in quantifying and describing drought conditions, relying primarily on historical climate and precipitation data. These indices have been instrumental in supporting stakeholders to understand drought dynamics and develop approaches to mitigate their consequences. However, the outstanding advanced remote sensing technologies with traditional data sources have shown a favorable route to improve drought assessment accurateness and spatial coverage. This integration of real-time satellite data, ground-based measurements, and meteorological observations offers a remarkable chance to refine our understanding of droughts and improve early warning systems (Dai, 2011; Eriyagama, et al., 2009; Mohammad, et al., 2018).
This scientific paper comprehensively analyzes drought indices, integrating conventional meteorological data with cutting-edge remote sensing techniques. It evaluates the performance and reliability of various drought indices when applied to both accurate and remote sensing-derived datasets. By leveraging the synergy of these two separate information sources, we aim to understand the spatiotemporal aspects of drought and examine how this approach can guide more accurate, powerful, and informative drought assessments.
The following sections delve into the methodology of this study, present the datasets used, and consult the different drought indices under the pressure of climate change. Afterward, the study will analyze the results and highlight the benefits and restrictions of this integrated approach. Eventually, our results will contribute to the continuing lesson on refining drought monitoring and management techniques in an era of climate change and increasing environmental concerns.
Through this study, we aspire to supply a foundation for better resilient and adaptable measures to different drought events, finally improving the capacity to protect natural systems and lower the threat of water scarcity. The Amman-Zarqa Basin (AZB), located in the arid region of Jordan, has faced the critical challenge of water scarcity and drought risk, (Shatanawi et at., 2022; Mohammad, et al., 2016). This region is described by variable precipitation patterns, increasing temperatures, and increasing water demand due to fast urbanization and population growth (Odeh, et al, 2023, Mohammad, et al., 2016). In such conditions, the practical assessment and monitoring of drought are necessary to sustain water resources, agricultural methods, and disaster mitigation.
This scientific study comprehensively evaluates crucial drought indices by recognizing the value of monitoring drought in the basin. These indices, namely the Standardized Precipitation Index (SPI), the Standardized Water-Level Index (SWI), the Normalized Difference Vegetation Index (NDVI), and the Normalized Difference Moisture Index (NDMI), present a multifaceted strategy for drought assessment by evaluating vegetation health, soil moisture, and rainfall anomalies. The selection of these four indices denotes an integrated approach to drought analysis. SPI delivers a recorded perspective on precipitation variations, permitting the quantification of meteorological drought. SWI, developed to use data from wells to investigate the impact of drought on groundwater recharge. Results can be interpolated between points is crucial in comprehending subsurface water availability.
On the other hand, NDVI, derived from remote sensing data, is an incalculable tool to evaluate vegetation health and catch early indications of water tension. NDMI completes NDVI by explicitly concentrating on water content in the soil, delivering paramount insights into the overall hydrological states (Hayes, 2011; Keyantash, 2021; Taloor et al., 2021). Combining these indices in our research aims to improve the accuracy and comprehensiveness of drought assessments in the basin. Assuming a combination of vegetation, moisture, precipitation, and soil parameters, we expect to provide a more potent foundation for drought early warning systems and sustainable resource management. Using remote sensing technology with ground-based databases shows the spatial and temporal scope needed to monitor the region’s dynamic drought conditions effectively.
The methodology applied SPI, SWI, NDVI, and NDMI to the basin, the datasets and tools utilized will be discussed, and the performance of these indices in characterizing drought events will be evaluated. Through strict analysis and interpretation, we aspire to donate necessary insights into the basin’s vulnerability to drought and suggest strategies for mitigating its consequences. Our study seeks to empower local authorities, stakeholders, and decision-makers with the means and knowledge required to develop proactive policies and adaptation measures, eventually promoting stability in the face of ongoing climatic challenges. In an era of climate uncertainty, assessing drought using a holistic approach is advantageous and an imperative step toward protecting the sustainability and prosperity of this essential region.
2. STUDY AREA
The AZB, a pivotal geographic region within the Hashemite Kingdom of Jordan, represents a microcosm of the Middle East’s arid challenges. This basin covers approximately 4,000 square kilometers and encompasses the two major cities of Amman, the capital, and Zarqa, an industrial, agricultural and commercial hub (Figure 1, A). The region is characterized by a unique blend of urbanization, agricultural activities, and water resource management challenges, set against a semi-arid to arid climate. The AZB is emblematic of the intricate relationship between a growing population and the finite water resources available (Odeh et al., 2023; Mohammad et al., 2016; Shatanawi et al., 2022). The soaring population in this area, driven by urbanization and rural-to-urban migration, places increasing stress on water supplies for domestic, industrial, and agricultural use. The region’s climate further exacerbates these challenges, with hot, dry summers and erratic, often limited, rainfall during winter.
Consequently, the basin frequently contends drought conditions necessitating precise and proactive monitoring to safeguard water availability, agriculture, and overall socio-economic stability. The study area’s geographical and climatic characteristics and its importance as a demographic and economic nucleus underscore the critical necessity for practical drought assessment and management. Understanding and addressing drought within the AZB is not merely an academic endeavor but a matter of existential importance. It demands a multidisciplinary approach combining remote sensing technologies, meteorological data, hydrological insights, and vegetation analysis to develop comprehensive resilience and resource sustainability strategies.
Throughout this study, we aim to delve deeper into the nuances of drought assessment within the Amman-Zarqa Basin, with a focus on how NDVI, NDMI, SPI, and SWI can perform as essential tools for achieving a deeper understanding of this dynamic and weak region. Our research endeavors to shed light on the interplay of environmental, meteorological, and anthropogenic aspects that shape the basin’s drought vulnerability and, ultimately, to deliver helpful recommendations for water resource management and drought mitigation in this critical area.
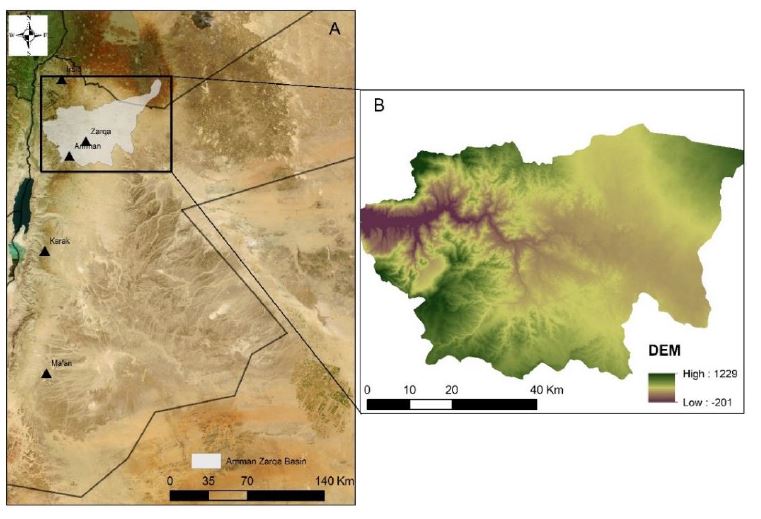
The AZB holds a distinguished class in the context of drought assessment and management in Jordan. It is not only the largest catchment area in the country but also hosts the highest population and significant agricultural activities. Consequently, the AZB is vital in managing water resources, making it the top priority for investment in drought-related studies. The topography of the catchment area shows marked variations, with elevations ranging from approximately -350 meters in the west to about 1,200 meters above sea level in the east. These elevation differences extend from the hilly landscape in the western regions to the surrounding areas along the basin’s boundaries, affecting the distribution of water resources and the area’s vulnerability to drought (Odeh et al., 2009). Elevation levels gradually taper off towards the central parts of the catchment and in the western direction, contributing to the remarkable hydrological dynamics of the region, (Figure 1, B) (Mohammad and Odeh, 2016). Various rock units and formations geologically describe the study area, showing geological periods from the Jurassic to the Quaternary. This geological diversity is crucial for the basin’s hydrology, hydrogeology, and response to drought conditions (Bender, 1974).
3. METHODOLOGY
In arid and semi-arid areas, the escalating challenges posed by climate change and water scarcity exacerbate the vulnerability of ecosystems, water systems, and human communities. The unique characteristics of these regions make them particularly susceptible to the effects of a changing climate. As temperatures rise and precipitation patterns become increasingly unpredictable, the frequency and severity of droughts are on the rise, amplifying water shortages. Applying Geographic Information Systems (GIS) and Remote Sensing (RS) techniques becomes even more crucial in such contexts. These technologies enable real-time monitoring of water resources, vegetation health, and landuse dynamics, offering valuable insights for sustainable water management and developing adaptive strategies. GIS is described as a key technique in hydrological studies, serving as a vital tool for generating thematic maps. These maps play a crucial role in understanding the spatial distribution of natural phenomena, including water drought (Shatanawi, et al., 2022; Mohammad, et al., 2018; Alam, et al., 2017). The initial step in the modeling process involved creating a geodatabase for the weather stations within the designated area. This facilitated the organization of data for the model, with the geodatabase attributes representing the parameters measured by the climate stations. Thematic maps were then produced through the interpolation of station data to assess the drought index.
GIS and RS enhance our understanding of the complex interactions within arid environments and provide vital tools for decision-makers to navigate the intricate challenges of climate-induced water scarcity, promoting resilience and sustainable development in these naturally fragile environmental components. Through earth observations (EO), RS provides a steady and near-real-time monitoring capability, capturing changes in land surface conditions such as reduced vegetation cover and limited water bodies indicative of drought stress. The integration of GIS and RS enables the identification of regions most affected by drought.
Drought defines a regular and frequent aspect of the climate across almost all climatic zones. It displays as a temporary anomaly in both high and low-precipitation regions. In contrast to aridity, a permanent climate trait limited to areas with low rainfall, drought is region-specific, reflecting distinct meteorological, hydrological, and socioeconomic attributes. Drought indices integrate extensive data on rainfall, stream flow, and various water supply indicators. The mapping of drought using GIS and RS techniques represents a vital and essential strategy in the face of rising aridity and water shortages deepened by climate change. Numerous research studies have delved into drought assessment through various indices, models, and water balance simulations. Many indices are utilized in drought monitoring, such as the SPI, the SWI, the NDVI, and the NDMI (Mohammad et al., 2018). Many water planners consider it helpful to refer to one or numerous indices when assembling decisions. Some of the significant drought indices applied worldwide are illustrated below:
3.1 Ground drought indices
Standardized Precipitation Index (SPI) is based on the rainfall probability for any period, so it is mentioned as meteorological drought index. It can be calculated for various time scales, providing an early warning indicator of drought and helping assess drought severity (Cheval, 2015). The SPI is a widely used tool in hydrology and climatology for evaluating and quantifying precipitation patterns. Created to provide a standardized measurement of meteorological drought, SPI offers an organized strategy for indicating precipitation anomalies over time. By normalizing precipitation data and converting it into a standard normal distribution, SPI allows comparisons of precipitation deficits or surpluses across diverse regions and climatic conditions. This index is helpful for water resource management, agriculture, and environmental planning, as it helps determine and monitor drought conditions, allowing for more informed decision-making and adaptive strategies to mitigate the impacts of water scarcity. The flexibility of SPI in grabbing drought severity over different time frames makes it an adaptable tool for researchers, policymakers, and water resource specialists.
Precipitation shows an asymmetrical frequency distribution characterized by most occurrences at lower values and a swift drop in the probability of higher precipitation totals. Guttman investigated six positively skewed analytical distributions for Standardized Precipitation Index (SPI) calculations (Guttman, 1999). The SPI method adopted by depends on the incomplete gamma distribution (McKee et al., 1993). The input data undergoes analysis in SPI algorithms to optimally evaluate two critical coefficients controlling the changeover process. The observed precipitation data are then transformed into Gaussian (normal) equivalents. Subsequently, these transformed precipitation values are utilized to calculate the dimensionless SPI, representing the standardized precipitation anomaly.
The SPI used to be calculated using the following equation:
SPI=((P-P*))/σP (1)
Where: where P = precipitation, P* = mean precipitation, σP = standard deviation of precipitation.
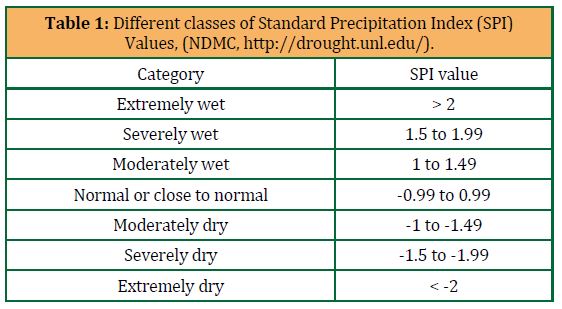
The dimensionless SPI values are typically associated with the drought descriptions of “dry,” “moderately dry,” or “extremely dry,” as well as other labels for near-normal conditions or precipitation excesses.
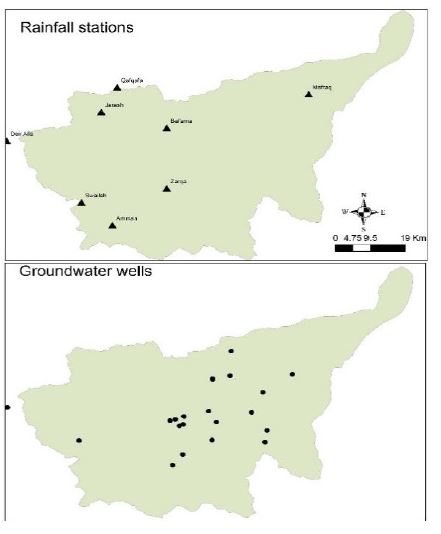
The historical data on daily precipitation spanning from 1980 to 2020 was acquired from the different rainfall stations strategically located across the targeted area. The data was sourced from the Jordan Meteorological Department and the Ministry of Water and Irrigation of Jordan. The observed period encompasses the typical rainy season in the AZB, which typically commences in mid-October and concludes in early May of the subsequent year. For detailed information on the names, locations, coordinates, and elevations of the six stations utilized in the precipitation analysis, and the distribution of the stations are shown in figure 2.
3.2 Standardized Water-Level Index
Bhuiyan presented the Standard Water-Level Index (SWI) in 2004, to detect irregularities in groundwater levels resulting from the impact of drought on exact aquifers. This study employed groundwater level data from the Ministry of Water and Irrigation from 1980 to 2020. The SWI applies to normalize seasonal groundwater levels. The index is calculated by dividing the difference between the seasonal water level and its long-term seasonal average by the standard deviation. Thus, the below equation 2 presents the SWI:
SWI=((Wij -Wim ))/σ (2)
Wij is the seasonal water level for the ith well, and jth observation, Wim is its seasonal mean and s is its standard deviation. SWI is an indicator of water table reduction and an indirect measure of recharge, thus an indirect reference to drought. The original SWI estimation applied standardization of the groundwater level data but did not involve normalization (Bhuiyan, 2004; Mohammad, et al 2018). The estimation process and classification scheme of SWI was modified for drought analysis (Bhuiyan et al., 2006).
In this study, groundwater levels of 20 wells in the targeted area (Figure 2) have been gathered from MWI and analyzed to investigate the drought impacts on the hydrological regime. SWI value has been classified and used as a reference to hydrological drought severity (Table 1). SWI has been calculated using different years’ mean seasonal water levels (1980-2020), but some years were missed according to limited data for applying the concept. SWI values of the wells have been interpolated in a GIS to generate SWI maps of the basin.
3.3 Remote sensing indices
Vegetation absorbs solar radiation in different bands in various frequency ranges and wavelengths and emits a diverse portion of it back into them. The ratio of refracted radiation in specific bands, such as near-infrared (NIR), red (RED), and short-wave infrared (SWIR), changes with plant health and water stress.
Normalized Difference Vegetation Index (NDVI) is a crucial vegetation indicator widely utilized in remote sensing and environmental monitoring. It can indicate drought conditions due to its sensitivity to changes in vegetation health and moisture content. As vegetation becomes stressed or experiences water deficiency, its reflectance in the near-infrared (NIR) and red bands can alter, directing to variations in NDVI values. NDVI designed to evaluate the health and density of vegetation, NDVI uses satellite or aerial imagery to estimate the difference between reflected near-infrared (NIR) and red light. The formula for NDVI is provided as follows:
NDVI= (NIR-Red)/(NIR+Red) (3)
With values ranging from -1 to 1, NDVI serves as a quantitative measure of the amount and vigor of vegetation cover (Kriegler, 1969). Healthy vegetation strongly reflects NIR, resulting in higher NDVI values, while absorption of red light by chlorophyll contributes to lower red values, (Rhew et al., 2011; Glenn and Tabb, 2019). As a result, NDVI is a powerful tool for delineating various land cover types, identifying changes in vegetation over time, and assessing environmental conditions. Positive NDVI values generally indicate healthy and dense vegetation, while negative values are associated with non-vegetated surfaces like water bodies.
Normalized Difference Moisture Index (NDMI) is widely used in remote sensing to evaluate moisture content in vegetation and soil, (Gao, 1996). NDMI emanates from satellite or aerial imagery analysis like other normalized difference indices (USGS, accessed May, 2023). NDVI was designed to assess vegetation health based on the differences in reflectance between near-infrared and red bands. As remote sensing technology evolved, researchers recognized the importance of extending similar techniques to monitor moisture conditions.
NDMI, as a specific index focusing on moisture content, likely emerged in the context of this broader history of vegetation indices. The formula for NDMI, as shown below, applies the NIR and shortwave infrared (SWIR) bands, with higher values implying higher moisture content. The expansion and application of moisture-related indices have played a vital role in environmental monitoring, agriculture, and hydrology. These indices allow researchers and land managers to assess water availability, drought conditions, and the overall health of ecosystems.
It is advantageous for monitoring changes in water availability and drought conditions. NDMI is calculated through the conventional formula:
NDMI= (NIR-SWIR)/(NIR+SWIR) (4)
NDMI values range from -1 to 1, wherein higher positive values signify increased vegetation moisture content, while lower values reflect the reduced moisture content or water stress status within the vegetation. Negative NDMI values are often linked to non-vegetated regions or areas characterized by extremely low moisture content.
4. RESULTS AND DISCUSSION
4.1 Ground drought indices
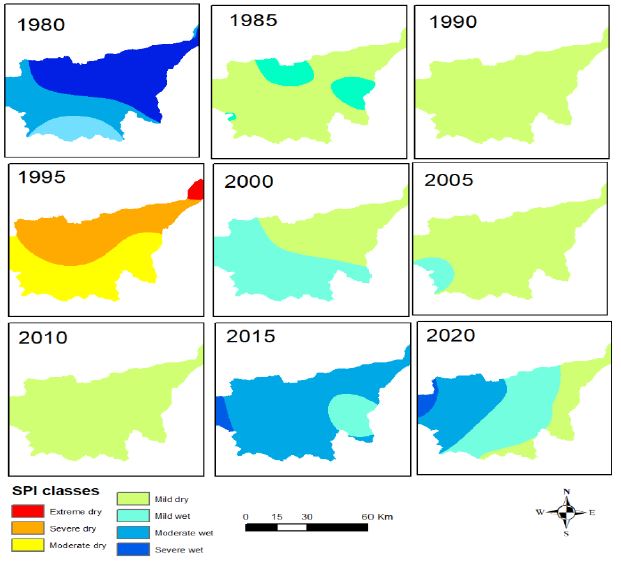
Standardized Precipitation Index: the long-term average precipitation for the rainfall stations representing the entire basin varies between the different stations located within and around the targeted basin due to the high diversity in the topographic and climatic conditions of the AZB. The long-term average of precipitation over AZB was estimated to be around 200 mm/yr calculated using the thiessen polygon method, (Shatanawi et al., 2022). The drought categories given in Table 1 are used for the evaluation and interpretation of the SPI (McKee et al., 1993). The SPI values for the years 1980-2020 are presented in Figure 3 and shows variations in the drought index in different years.
Mapping the SPI according to the given method in table 2, showed variant distribution of the index within the targeted area, as shown in figure 3; SPI maps for the basin showed that severe to extreme drought events occurred in 1995; mild dry events were prevalent during the years 1985, 1990, 2000, 2005, and 2010 as shown in Figure 3, which represents the SPI maps for the targeted area within the focused years. Figure 3 also shows that different years display wet events, as shown in the years 1980, 2015, and 2020. Near normal events in all rainfall stations were recorded in 1985, and 2000.
4.2 Standardized Water-Level Index
Groundwater levels of 20 wells of the region (Figure 2) have been gathered from the ministry’s data base, and have been analyzed to evaluate the effects of groundwater level drought on hydrological regime. SWI values have been categorized and employed as a reference point to hydrological drought severity (Table 2). SWI has been estimated using the mean seasonal water levels of 25 years (1995-2020) for the giving wells. SWI values of the wells have been interpolated in a GIS environment to generate SWI maps of the AZB.

The research indicates a consistent decrease in water levels across various wells in the study area from 1995 to 2020. Figure 4 shows that the years 2015, and 2020 are mainly moderate dry, with some spots of extreme and
severe dry areas according to the SWI, while the years 1995, 2000, and 2005 areas are showing non dry to mild dry classes according to the SWI.
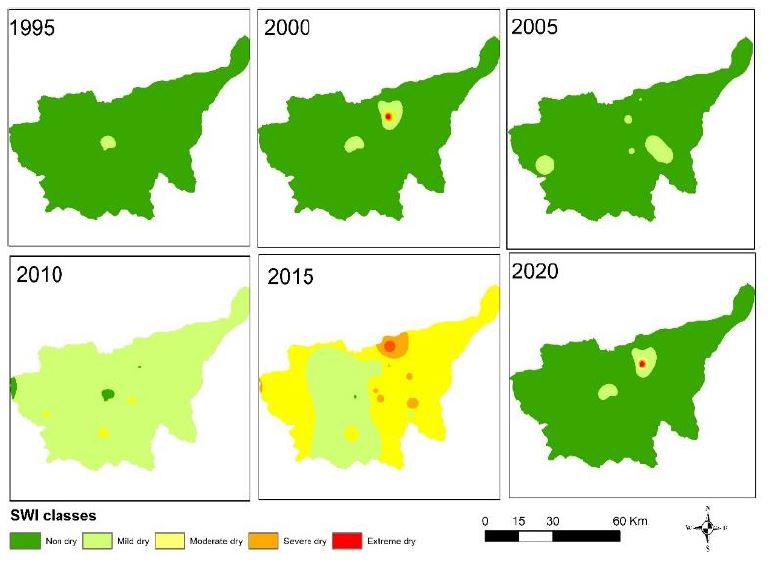
Despite some years experiencing wet conditions based on the SPI and high rainfall, the majority of the AZB region faced water stress events. Notably 2015 was SPI-identified as wet years, yet they exhibited extremely dry events in the SWI. Most years in the targeted area were characterized by water stress, marked by severe and extreme drought events, with the exception of 1995, 2000, and 2005 which showed non drought and mild drought classes in the majority of the basin, (as shown in Figure 4). SWI results highlight the most extreme drought events in 2010, 2015 and 2020; where the basin experienced extreme drought. In comparison to SPI maps, the SWI maps consistently reveal severe and extreme drought events, underscoring the detrimental impact on groundwater levels in the study area.
4.3 Remote sensing drought indices
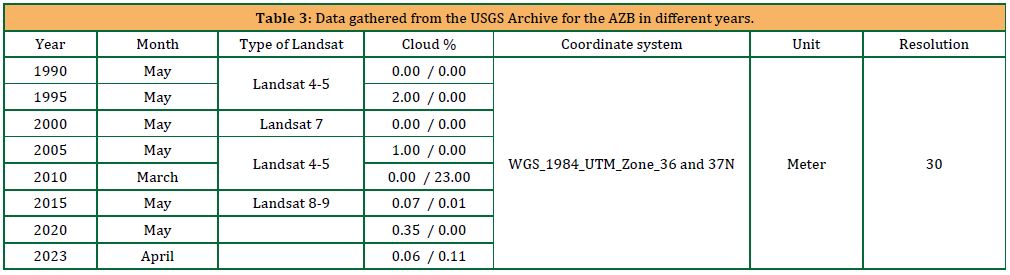
The research applies a multi-stage analysis to evaluate drought conditions over the past three decades (1990–2023) at five-year breaks (i.e., 1990, 1995, …, 2020, and 2023) in the AZB. Satellite images for each five-year interval from 1990 to 2023 were acquired and extracted from the USGS archive (https://earthexplorer.usgs.gov/). Table 3 summarizes the specifics of the data gathered from the USGS library for 1990, 1995, 2000, 2005, 2010, 2015, 2020, and 2023.
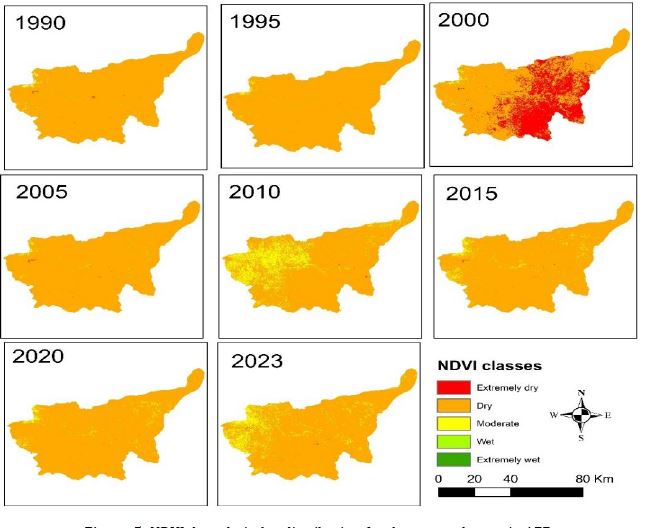
The Normalized Difference Vegetation Index NDVI and Difference Moisture Index NDMI were used in attempting to understand the spatiotemporal changes of drought conditions in the AZB, (Figures 5–6).
First, the NDVI index’s highest values of NDVI were 0.4871, 0.4112, 0.5248, 0.8192, 0.6011, 0.543, 0.5713, and 0.5833 for the years 1990, 1995, 2000, 2005, 2010, 2015, 2020, and 2023, respectively. Nevertheless, the NDVI index’s lowest values were -0.3186, -0.2105, -0.6364, -0.5792, -0.5621, -0.2989, -0.1990, and -0.2408 for the years 1990, 1995, 2000, 2005, 2010, 2015, 2020, and 2023, respectively. The classes’ variation extend from extremely dry to extremely wet in different years, as shown in Figure 5.
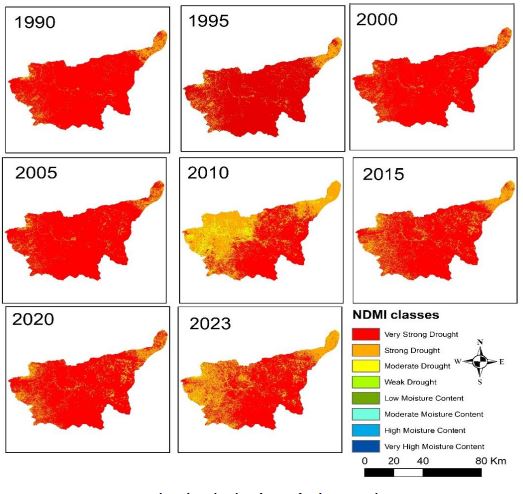
The decline observed in NDMI values over the targeted decades can be attributed to the precipitation reduction over the basin. NDMI values range from -1 to 1, with negative values representing dry conditions and positive values indicating wet situations. NDMI values near 0 reveal medium moisture levels. This index is often employed to observe crop moisture stress and evaluate vegetation’s general health and productivity. NDMI index’s results in AZB mapped as follow: the highest values of NDMI were 0.4007, 0.3131, 0.4470, 0.6362, 0.4250, 0.4762, 0.3669, and 0.4390 for the years 1990, 1995, 2000, 2005, 2010, 2015, 2020, and 2023, respectively. Nevertheless, the NDMI index’s lowest values were -0.5390, -0.5141, -0.5559, -0.5684, -0.4484, -0.3966, -0.4178, and -0.3835 for the years 1990, 1995, 2000, 2005, 2010, 2015, 2020, and 2023, respectively. The classes variation extend from extremely dry to very high moisture content in different years, as shown in Figure 6.
5. CONCLUSION
In conclusion, integrating remote sensing-derived indices such as NDVI and NDMI with real-world meteorological and hydrological data, SPI, and SWI presents a rugged technique for comprehending and managing water resources. By merging details from satellite imagery with ground-based records, we earn an additional extensive and slight understanding of the water system, including precipitation patterns, soil moisture levels, vegetation health, and water availability. This integration allows us to observe environmental changes over large spatial scales and evaluate their impacts on agriculture and water resources.
Furthermore, combining these indices with real-world data allows for the outcome of predictive models and early warning systems for environmental risks such as droughts and floods. Through this integration, we contribute to advancing our understanding of drought dynamics and facilitate informed decision-making for mitigating the impacts of water scarcity on both natural ecosystems and human societies. The research results show a consistent reduction in water levels across different wells in the study area from 1995 to 2020. SWI analysis depicted mostly moderate dry conditions in 2015 and 2020, with some areas undergoing extreme and severe dryness, with non-dry to mild dry classes observed in 1995, 2000, and 2005. SPI mapping demonstrated mixed distributions within the basin, showcasing severe to extreme drought events in 1995, while mild dry events dominated in 1985, 1990, 2000, 2005, and 2010. Wet events were evident in 1980, 2015, and 2020. NDVI values fluctuated between extremes, with the highest recorded in 1990, 1995, 2000, 2005, 2010, 2015, 2020, and 2023, and the lowest in the same years. The NDMI index displayed a similar pattern, with variable values displaying moisture levels varying from extremely dry to very high moisture content. Overall, the observed declines in the indices values over the decades suggest reduced precipitation across the basin, highlighting the significance of these indices in monitoring environmental conditions and vegetation health.
REFERENCES
Alam, A., Bhat, M.S., Kotlia, B.S., Ahmad B., Ahmad, S., Taloor, A.K., Ahmad H.F., 2017. Coexistent pre-existing extensional and subsequent compressional tectonic deformation in the Kashmir basin, NW Himalaya Quat. Int., 444, Pp. 201-208.
Bender, F., 1974. The geology of Jordan, contribution to the regional geology of the earth, supplementary edition of. Gebrueder Borntraeger, Berlin.
Bhuiyan, C., 2004. Various drought indices for monitoring drought condition in Aravalli terrain of India. In: Proceedings of the XXth ISPRS Conference. Int. Soc. Photogramm. Remote Sens, Istanbul Available at: http://www.isprs.org/istanbul2004/comm7/papers/243.
Bhuiyan, C., Singh, R.P., Kogan, F.N., 2006. Monitoring drought dynamics in the Aravalli region (India) using different indices based on ground and remote sensing data. International Journal of Applied Earth Observation Geoinf., Pp. 289–302.
Cheval, S., 2015. The Standardized Precipitation Index—An overview. Rom. J. Meteorol.
Dai, A., 2011. Drought under global warming: A review. Wiley Interdisciplinary Reviews: Climate Change, 2 (1), Pp. 45–65. https://doi.org/10.1002/wcc.81
David, M.G., and Amy, T., 2019. Evaluation of Five Methods to Measure Normalized Difference Vegetation Index (NDVI) in Apple and Citrus, International Journal of Fruit Science, 19 (2), Pp. 191-210. DOI: 10.1080/15538362.2018.1502720
Eriyagama, N., Smakhtin, V., and Gamage, N., 2009. Mapping Drought Patterns and Impacts: a Global Perspective. IWMI Research Report No. 133. Colombo, International Water Management Institute, http://www.iwmi.cgiar.org/Publications/IWMI_Research_Reports/PDF/PUB133/RR133.pdf.
Gao, B.C., 1996. Ndwi- a normalized difference water index for remote sensing of vegetation liquid water from space. Remote Sensing Environment, 58, Pp. 257–266.
Guttman, N.B., 1999. Accepting the Standardized Precipitation Index: A calculation algorithm. Journal of the American Water Resources Association, 35 (2), Pp. 311-322.
Hayes, M.J., 2011. Comparison of Major Drought Indices: Introduction. National Drought Mitigation Center, http://drought.unl.edu/ Planning/Monitoring/ComparisonofIndicesIntro.aspx.
Keyantash, J., 2021. Indices for Meteorological and Hydrological Drought. In: Pandey, A., Kumar, S., Kumar, A. (eds) Hydrological Aspects of Climate Change. Springer Transactions in Civil and Environmental Engineering. Springer, Singapore.
Kriegler, F., 1969. Preprocessing transformations and their effects on multispectral recognition. In: Proceedings of the Sixth International Symposium on Remote Sensing of Environment, pp. 97–131.
McKee, T.B., Doesken, N.J., and Kleist, J., 1993. The relationship of drought frequency and duration on time scales. Eighth Conference on Applied Climatology, American Meteorological Society. Jan 17-23, 1993, Anaheim CA, Pp. 179-186.
Mohammad, A.H., Shatanawi, K., Odeh, T., 2016. A modified modeling of potentiality and vulnerability of the groundwater resources in Amman Zarqa Basin, Jordan. Kuwait J. Sci. 43 (1), Pp. 208–221.
Mohammad, A.H., Jung, H.C., Odeh, T., Bhuiyan, C., Hussein, H., 2018. Understanding the impact of droughts in the Yarmouk Basin, Jordan: monitoring droughts through meteorological and hydrological drought indices. Arab J Geosci., 11 (5), Pp. 103.
National Drought Mitigation Center, University of Nebraska-Lincoln NDMC, http://drought.unl.edu/
Odeh, T., Sawaqed, R., Murshid, E.A., 2023 GIS-based analytical analysis for selecting potential runoff harvesting sites: the case study of Amman-Zarqa Basin. Sustain. Water Resour. Manag. 9, Pp. 97. https://doi.org/10.1007/s40899-023-00879-2
Padrón, R.S., 2020. Observed changes in dry-season water availability attributed to human-induced climate change. Nat. Geosci., 13, Pp. 477–481.
Rhew, I.C., Vander Stoep, A., Kearney, A., Smith, N.L., Dunbar, M.D., 2011. Validation of the normalized difference vegetation index as a measure of neighborhood greenness. Ann. Epidemiol., 21 (12), Pp. 946–952. https://doi.org/10.1016/j. annepidem.2011.09.001.
Shatanawi, K., Mohammad, A.H., Odeh, T., Arafeh, M., Halalsheh, M., Kassab, G., 2022. Analysis of Historical Precipitation in Semi-Arid Areas–Case Study of Amman Zarqa Basin. J. Ecol. Eng., 23, Pp. 101–111.
Takeshima, A., 2020. Global aridity changes due to differences in surface energy and water balance between 1.5 °C and 2 °C warming. Environ. Res. Lett., https://doi.org/10.1088/1758-5090/0/0/000000
Taloor, A.K., Manhas, D.S., Kothyari, G.C., 2021. Retrieval of land surface temperature, normalized difference moisture index, normalized difference water index of the Ravi basin using Landsat data Applied Computer. Geosciences, 9, Article 100051.
USGU,www.usgs.gov/landsat-missions/normalized-difference-moisture-index#:~:text=Normalized%20Difference%20Moisture%20Index%20%28NDMI%29%20is%20used%20to,the%20NIR%20and%20SWIR%20values%20in%20traditional%20fashion
| Pages | 234-240 |
| Year | 2024 |
| Issue | 2 |
| Volume | 8 |
