
ANALYSIS OF WATER CRITICAL LEVEL BASED ON METEOROLOGICAL WATER AVAILABILITY AND DOMESTIC WATER NEEDS
Journal: Water Conservation and Management (WCM)
Author: Hermin Poedjiastoeti, Hasti Widyasamratri, Ari Sentani
Print ISSN : 2523-5664
Online ISSN : 2523-5672
This is an open access article distributed under the Creative Commons Attribution License CC BY 4.0, which permits unrestricted use, distribution, and reproduction in any medium, provided the original work is properly cited
Doi: 10.26480/wcm.03.2024.251.256
Abstract
 Determining the value of water demand in the residential sector and the meteorological water availability are the two main objectives of the Karanggeneng watershed’s water criticality study. The water balance during a ten-year period in the Karanggeneng watershed is calculated using the water criticality index. The Thornthwaite-Matter meteorological water balance approach, which takes into account regional rainfall, potential evapotranspiration, and Water Holding Capacity (WHC) values, is used to determine water availability values. The population and area have a major impact on the amount of water needed. The critical water index value for the Karanggeneng watershed area will be determined by comparing water availability and demand. The study’s findings indicate that in places with dense populations and/or little precipitation, household water is crucial. Due to the influence of monthly rainfall, the value of water availability was at its lowest in 2019 and at its highest in 2014. Every year, the value of the need for water rises in tandem with population growth. According to the water criticality index calculation, the Karanggeneng watershed value was below 75% from 2014 to 2017 and from 2020 to 2022, but in 2018 and 2019, the index value above 100% (extremely critical condition).
Keywords
Karanggeneng watershed, Water critical level, household water
1. INTRODUCTION
Drought is considered by many to be the most complex but least understood of all natural hazards, affecting more people than any other hazard (Wilhite, 2000). Drought is a natural disaster that lasts for a long time, occurs dramatically and has an impact on multi-sectors (Zhu, 2023; Achite etal., 2022). Drought is an indication of the criticality of a watershed which is characterized by the occurrence of degradation and damage to the hydrological system of the watershed, with water shortages, especially in the dry season.
The Karanggeneng Watershed with its main river the Karanggeneng River, is one of the river basins used for the management of water resources originating from the North Limestone Mountains of Rembang Regency and empties into Tanjungsari Village, Rembang District with a main river length of 48.17 km (Hidayat, 2013). Like the condition of the Rembang Regency area in general, this area is also vulnerable to drought. Rembang Regency has low rainfall, with 4 to 5 wet months, while the rest fall into the category of moderate to dry months. There is rain for 1 year which is erratic, so the implication is that drought often occurs in the Rembang Regency area (Wibowo, 2018; PDAM Kabupaten Rembang, 2013).
In facing the increasingly complex challenges of supplying and managing raw water, it is not sufficient to provide raw water only through the addition of infrastructure but must also be supported by the availability of data on the condition of water resources and the environment as well as forecasts of weather and climate conditions. The availability of water resources is a global threat that must be considered (Anna et al., 2016). The value of water availability can be obtained by using the Thornthwaite-Matter method of meteorological water balance analysis which is influenced by the value of rainfall, evapotranspiration and Water Holding Capacity (WHC). Meteorological water balance is used to obtain rainwater deficit and surplus values in a watershed which is used in the calculation of water availability.
The main objective of this study is to determine the criticality level of water based on the water balance of water availability and water demand in the Karanggeneng watershed. The water criticality index is obtained from the water balance of the Karanggeneng watershed based on a comparison of the values of water availability and water demand in the residential sector.
Water availability is the amount of water that enters the hydrological cycle in an area (Sosrodarsono et al., 2003). The hydrological cycle in each region has differences in its processes, causing differences in water availability. Calculation of water availability in an area is very necessary as a reference for utilization and conservation policies (Wang et al., 2022).
2. MATERIALS AND METHODS
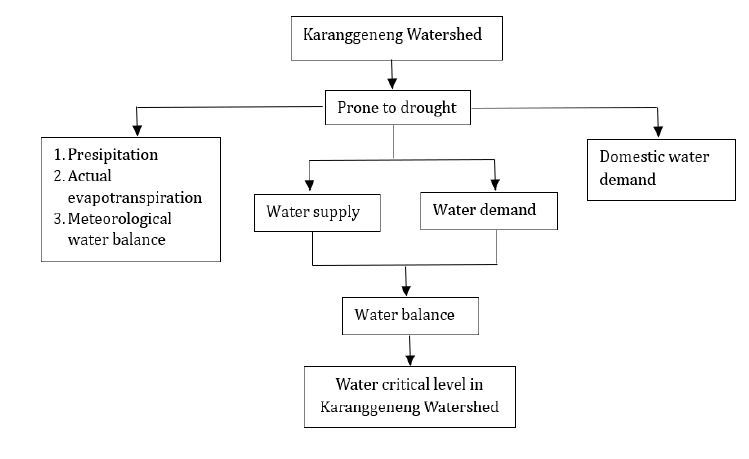
2.1 Theoretical Framework
To determine the level of water criticality in the Karanggeneng watershed, variables are used that influence the criticality level, such as water potential in the watershed based on rain data, actual evapotranspiration and water balance as well as domestic water needs in the Karanggeneng watershed.
2.2 Research sites
This research was conducted in the Karanggeneng Watershed, Rembang Regency, which is part of the Jratunseluna River Region. The Karanggeneng watershed has an area of 134.14 ha with the main river being the Karanggeneng River which has a river length of: 48.17 km. The upstream area of the Karanggeneng Watershed is in the North Limestone Mountains in Bulu District, Rembang Regency, while the downstream/estuary area is in Tanjungsari Village, Rembang District, Rembang Regency.
2.3 Data analysis
2.3.1 Regional Rainfall
Using daily rainfall readings and recordings from three rain stations, an average algebra will be used to determine the monthly rainfall. Additionally, the findings of past years’ calculations were made using the same methodology (Prawaka et al., 2016). Value of regional rainfall computed using Thiessen’s polygon approach (Ningsih, 2012). The Karanggeneng watershed area’s Thiessen Polygon Method is impacted by three rain stations: Rembang, Sulang, and Bulu.
2.3.2 Potensial Evapotranspiration
The entire amount of water that originates from the land’s surface and is released back into the atmosphere by vegetation and weather-related variables is known as potential evapotranspiration, or PET. Thornthwaite-Matter method is used to calculate potential evapotranspiration. The equation is as follows (Asdak et al., 2018).
EP=16 x (10T/I)^a (1)
i=(T/5)^1,514 (2)
I=∑_1^12▒i (3)
a=(0,675 x 10^(-6) x I^3 )- (0,77 x 10^(-4) x I^2 )+(0,01792 x I)+0,49239
Information:
EP = monthly potensial evapotranspiration uncorrected (mm/month)
ETP = corrected potensial evapotranspiration (mm/month)
T = monthly average air temperature (°C)
I = annual heat index
i = monthly heat index
f = latitude factor
2.3.3 Meteorological Water Balance Method Thornthwaite – Matter
The water balance is useful in determining suggestions for managing research areas in a surplus or deficit state (Mopangga, 2020). The water balance calculation method that will be used is the Thornthwaite-Matter method. The meteorological water balance approach from Thornthwaite – Matter can be used to analyze water availability (Wang et al., 2022). It involves calculating the water balance using the following data: monthly temperature, rainfall data, evapotranspiration potential, soil texture, and land usage. Water balance calculation steps are as follows:
Calculating monthly rainfall thickness (P)
Calculating monthly potential evapotranspiration (EP)
Calculating the difference between P and EP (PEP)
Calculating APWL (Accumulated Potential Water Loss), by:
The first negative (P-EP) value after the positive (P-EP) is derived as the absolute value of the first APWL
The first APWL value is added to the next negative |(P-EP)| is the second APWL value, and so on until the negative (P-EP) value runs out
If (P-EP) is positive, then APWL is zero.
Determine the Sto (WHC) value is a function of soil texture and root zone depth (mm/m)
Calculating the value of soil moisture storage (St), that is:
• St = Sto X e – (APWL/ Sto), if APWL ≠ 0
• St = Sto, if APWL = 0
• e = 2.178 (coefficient according to Thornthwaite & Matter, 1995)
Counting ΔSt every month
• ΔSt= St of the month in question –St last month
• For January minus December
Calculating actual evapotranspiration (EA)
• For wet months (P>EP), then EA = EP
• For dry months (P<EP), then EA = P+ |ΔSt|
Calculating water surplus (S)
• S = (P-EP) – ΔSt
Calculating the water deficit (D)
• D = EP – EA
Calculating the DRO (Direct Run Off) value with the formula:
(0.5 previous month surplus + 0.5 current month surplus)
2.3.4 Water Demand
The water demand that is taken into account is the domestic water demand. The data used to calculate water demand include population size, water consumption in urban and rural areas. The calculation of domestic water needs in the Karanggeneng watershed uses the following formula:
Q(DMI)=365 days x ((g(u))/1000 x P(u)+ (g(r))/1000 x P(r)) (4)
Information:
Q(DMI): Water demand for domestic needs
g(u) : Water consumption in urban areas
g(r) : Water consumption in rural areas
P(u) : Total population of the city
P(r) : Number of rural population
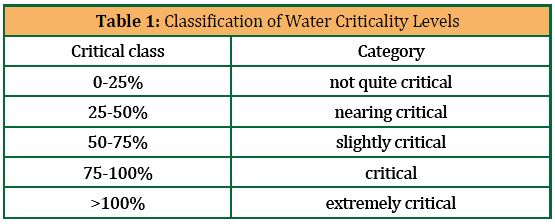
2.3.5 Water Criticality
A critical situation is where water demand exceeds 75% of water availability (Wang et al., 2022; Muliranti, 2016). The level of water criticality is expressed by the water criticality index (WCI) which can be calculated using the following equation:
WCI=Wn/Ws x 100% (5)
Information :
WCI: Water Criticality Index (%)
Wn: Total Water Requirement (m3)
Ws: Total Water Availability (m3)
Source : Hatmoko et al., 2012
3. RESULTS AND DISCUSSION
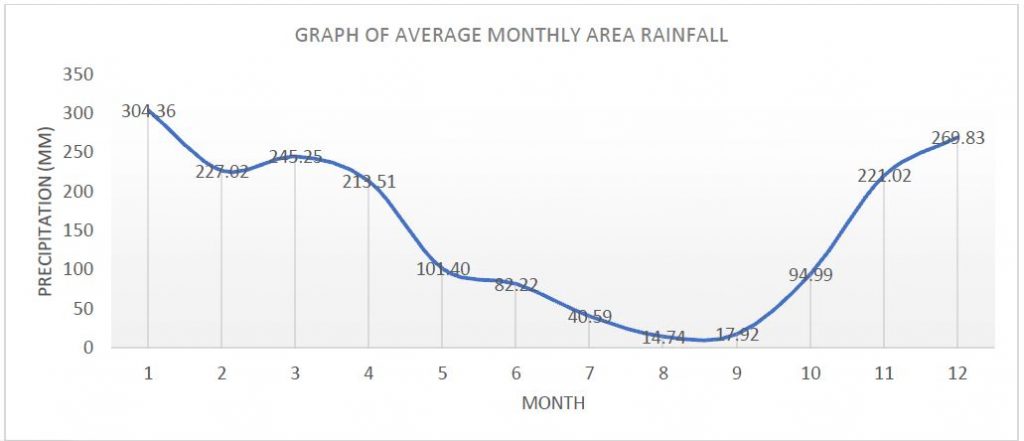
3.1 Rain Data Analysis
In this research, rainfall analysis was carried out using the Polygon Thiessen method which consists of 3 rainfall stations, namely Bulu Station, Sulang Station, and Rembang Station for a period of 10 years (2013-2022). Rainfall analysis for this area was taken at three rain station points, namely Bulu Station, Sulang Station, and Rembang Station. The graph below shows that the highest regional average rainfall is in January, and the lowest regional average rainfall is in August. For more details can be seen in Figure 2.
3.2 Availability of Meteorological Water
One of the meteorological water balance inputs is rainfall, so that the rainfall that fell for one year in the Karanggeneng watershed affects the surplus and deficit values of rainwater in the meteorological water balance in the Karanggeneng watershed. Besides being influenced by the value of rainfall, the water balance is also strongly influenced by the value of potential evapotranspiration (Niemeyer, 2008).
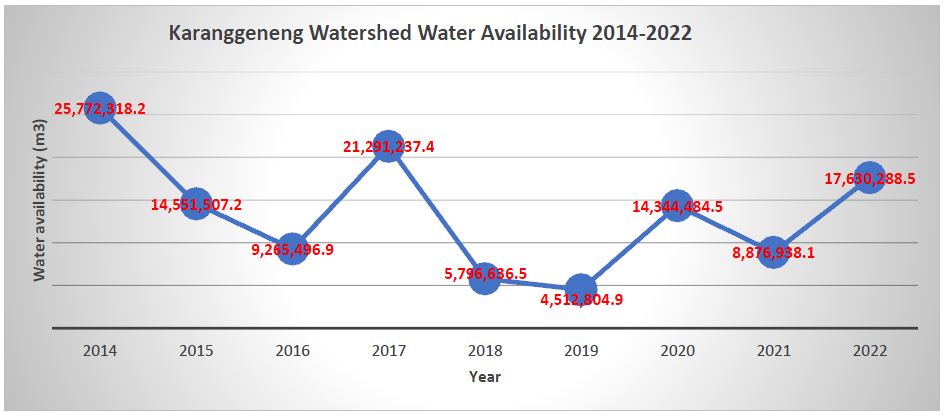
Availability of water in the Karanggeneng watershed by using the calculated value of the rainwater balance is obtained by multiplying the surplus value of rainwater by the area of the Karanggeneng watershed. Water availability increases every year due to population growth. Seeing the availability of water needed for various needs that must be met throughout the year, it is necessary to calculate the availability of water. For more details, see Figure 5.
The volume of water that enters a region’s hydrological cycle is known as water availability. There are variations in the operations of the hydrological cycle in every place, which results in variations in the availability of water. Water availability calculations must be made in a given area in order to inform conservation and use regulations. Values of water availability, which are impacted by rainfall, evapotranspiration, and water holding capacity (WHC), can be calculated using the meteorological water balance deficit and the Thornthwaite-Matter technique. The deficit and surplus values for rainwater in a watershed are obtained using the meteorological water balance and used to determine the availability of water.
3.2.1 Potensial Evapotranspiration
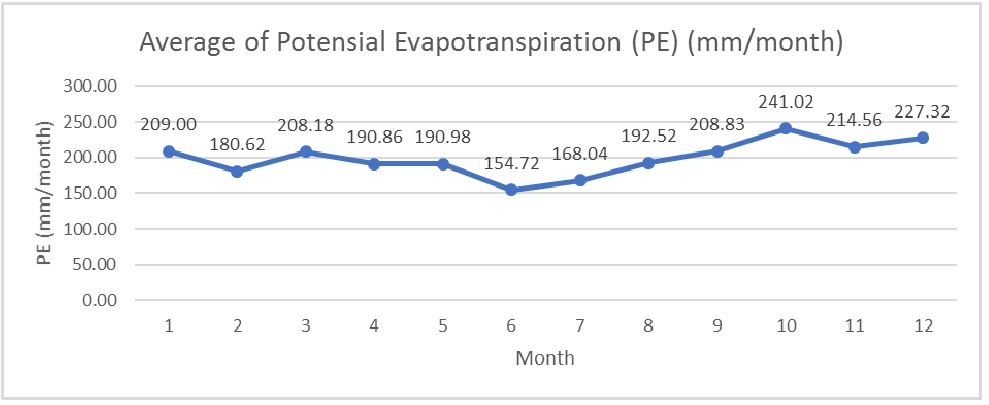
The potential evapotranspiration value in the Karanggeneng watershed is almost the same every month, while the rainfall value varies, so that at a lower rainfall value than the potential evapotranspiration value, there will be a deficit of rainwater in the Karanggeneng watershed as often occurs from May to November. The surplus value of rainwater each year will be used in calculating water availability in the Karanggeneng watershed.
The data used in calculating potential evapotranspiration is air temperature data. The Karanggeneng watershed does not have air temperature values, so the average temperature value from the nearest rain station, namely Tempuran Station in the Lusi watershed, is used. The lowest air temperature value in the Karanggeneng watershed fell in 2014 in September, 25.66 °C), while the highest temperature value was in 2019 in October (30.49 ℃).
The temperature value is directly proportional to the evapotranspiration value, so the evapotranspiration value in October 2019 was also the highest value. From the Thornthwaite method evapotranspiration data, it can be seen that the evapotranspiration values from June to October increased then decreased again in November, this can be identified as the end of the dry season, so that in November begins to enter the rainy season. For more details, see Figure 3.
3.2.2 Water Holding Capacity
The ability of the soil to store water is known as water holding capacity (WHC), and it is controlled by both soil type and land use, according to Thornthwaite (1957) in . To put it another way, WHC is the capacity of the soil to hold water. The types of plants found in a land use area can be combined with soil texture data to determine the WHC value. This will yield values for the root zone thickness and water availability for each combination of plant types and soil texture. These data are used in calculating the WHC value.
Because the WHC value is determined by the land’s capacity to hold water, the use of residential land is not taken into account. In residential areas, however, the land is already utilized for buildings, making it impossible to determine the WHC value. The large WHC value for the use of shrub and garden land is not only a result of the thickness of the root zone and the value of the available water; in other words, the area of use of shrub and garden land in the Karanggeneng watershed area is quite large, but the largest area is in the area There are homes in the Karanggeneng watershed. Shallow-rooted plants, such those used in dry fields and paddy
fields, have modest WHC values because, in addition to having a limited area value, they also have a small amount of water accessible and a dense root zone. This is especially true of plants used in rice fields.
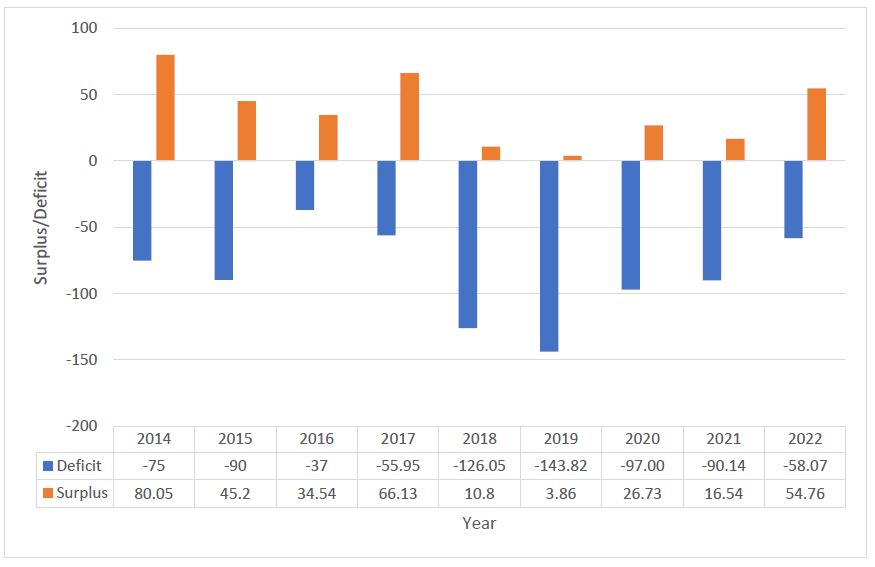
3.2.3 Water Balance
The purpose of the water balance is to assess the amount and timing of water surpluses and deficits in a watershed system, particularly with regard to the availability of rainwater in a given area. The water balance created by Thornthwaite – Matter is the one that is frequently utilized. Every year, from 2014 to 2022, meteorological water balance calculations are performed in the Karanggeneng watershed.
When precipitation (rainfall) exceeds potential evapotranspiration, there is a water surplus; conversely, when precipitation falls short of potential evapotranspiration, there is a water deficit. Table 10 up to for 2014 is excluded. Figures 4 present an overview of the incidence of water surpluses and deficits based on the same computation done for the years 2014 to 2022.
Water availability in the Karanggeneng watershed using the balance sheet calculation value Rainwater is obtained by multiplying the values surplus rainwater by area in the Karanggeneng watershed. The value of water availability decreased between 2014 – 2016, from 2017 – 2019 and from 2020 – 2021, this loss is attributed to the decrease in the surplus value of rainwater. The assessment of water availability increased in 2017, 2020 and 2022 reaching a maximum of 25,772,318.2 m3 in 2014.
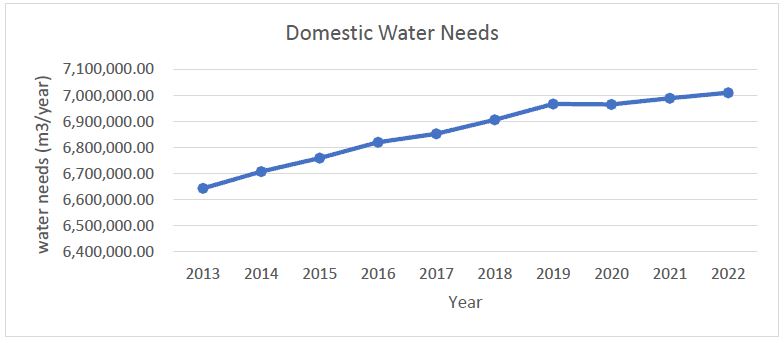
3.3 Domestic Water Needs
Domestic demands are determined using the Minister of Public Works’ Regulation No.14 of 2010 concerning the Minimum Service Standards for Public Works and Public Housing of 120 liters per person/day. In 2022, the population of the Karanggeneng watershed will be 160,075 people, divided among three sub-districts: Rembang, Bulu, and Sulang. Water demand is directly proportional to population size, hence the larger the population, the greater the demand.
The calculation results show that in 2022 the water demand in the Karanggeneng watershed will be the largest, namely 7,011,285 m3/year, while the smallest demand value will be in 2013, namely 6,643,671 m3/year. The magnitude of the water demand value is greatly influenced by the magnitude of the water demand value in the domestic sector. The magnitude of the domestic water demand value is influenced by the population size in that year. The high population increases the need for water for daily life because every resident needs water in their lives (Fajarina et al., 2021).
3.4 Water Criticality Index
Table 2: Water Criticality Level

The Karanggeneng watershed’s water criticality is determined by comparing the watershed’s supply and demand, as shown by the water balance, and then adjusting the resultant classification to the water criticality index. Over a ten-year period, the Karanggeneng watershed has four classes of water criticality. Every year, the value of water availability fluctuates based on the amount of rainfall and the annual growth in water demand, which causes the water criticality index value in the Karanggeneng watershed to fluctuate as well.
A decreasing water criticality index means that there was more rainwater available that year, whereas a big water criticality index means there was less rainwater available that year than in prior years. Water criticality is very critical (index value > 100%) in the Karanggeneng watershed from 2014 to 2022, which occurred in 2018 and 2019 (Table 2.) According to the water balance calculations, the shortfall was quite substantial that year, affecting water availability, which was steadily diminishing. The highly critical category can be defined as water requirements that cannot be met because they surpass water supply in the research area.
Areas with uneven rainfall throughout the year have the potential to experience drought. There is a need to adapt community capacity to face water shortages, from individuals to community groups supported by the government. Controlling water needs such as saving water usage.
Community culture needs to be adjusted by regulating water use, using water for important things, reducing physical activity, etc. Community adaptation capacity is also needed structurally by building rainwater harvesting buildings, reservoirs, dams, and increasing reforestation. The actions needed are to adapt humans to natural conditions, not just humans who depend on natural conditions.
4. CONCLUSION
In 2017, the Karanggeneng watershed has the highest water availability value of 25,772,318.2 m3 in 2014, which indicates the size of the value. Rainfall and potential evapotranspiration both affect the availability of water; the greater the annual rainfall value and the smaller the evapotranspiration value, the more water may be available.
Domestic water needs are very important influenced by population, the water demand in the Karanggeneng watershed will be the largest, namely 7,011,285 m3/year, while the smallest demand value will be in 2013, namely 6,643,671 m3/year.
The Karanggeneng Watershed’s Water Criticality Index is the outcome of comparing water availability and demand. The Karanggeneng watershed is categorized as “extremely critical” in 2018 and 2019, according to the results of the water criticality index, with a value over 100%.
ACKNOWLEDGMENT
This research was fully supported by fundamental research grant funds (contract no. 182/E5/PG.02.00PL/2023) provided by the Ministry of Education, Culture, Research and Technology Republic of Indonesia.
REFERENCES
Achite M., Bazrafshan O., Wałęga A., Azhdari Z., N. Krakauer, and T. Caloiero, 2022, Meteorological and Hydrological Drought Risk Assessment Using Multi-Dimensional Copulas in the Wadi Ouahrane Basin in Algeria, Water (Switzerland), vol. 14, no. 4, doi: 10.3390/w14040653.
Anna A. N., Priyono K. D., S. Suharjo, and Y. Priyana, 2016, Using Water Balance to Analyze Water Availability for Communities (A Case Study in Some Areas of Bengawan Solo Watershed), Forum Geografi, vol. 30, no. 2, p. 166, doi: 10.23917/forgeo.v30i2.2550.
Asdak C., S. Supian, and Subiyanto, 2018, Watershed management strategies for flood mitigation: A case study of Jakarta’s flooding, Weather Clim Extrem, vol. 21, no. September 2017, pp. 117–122, doi: 10.1016/j.wace.2018.08.002.
Fajarina D. K., H. Lukito, and A. Sungkowo, 2021. Evaluasi Tingkat Kekritisan Air di Dusun Baturturu dan Krinjing, Desa Mertelu, Kecamatan Gedangsari, Kabupaten Gunung Kidul, D.I.Yogyakarta, Prosiding Satu Bumi, vol. 3, no. 1, pp. 242–249, 2021.
Hatmoko, W., Radhika, Amirwandi, S. and Fauzi, M., 2012, Neraca Ketersediaan dan Kebutuhan Air pada Wilayah Sungai di Indonesia. Pusat Litbang Sumberdaya Air Badan Litbang Pekerjaan Umum.
Hidayat G., 2013, Kajian Optimalisasi dan Strategi Sumber Daya Air di Kabupaten Rembang Jawa Tengah, Universitas Diponegoro.
Mopangga S., 2020, Analisis Neraca Air Daerah Aliran Sungai Bolango, RADIAL: Jurnal Peradaban Sains, Rekayasa dan Teknologi, vol. 7, no. 2, pp. 162–171, doi: 10.37971/radial.v7i2.191.
Muliranti S. P., 2016, Kajian Ketersediaan Air Meteorologis Untuk Pemenuhan Kebutuhan Air Domestikdi Provinsi Jawa Tengah Dan DIY, pp. 1–23.
Niemeyer S., New drought indices, 2008, Options Méditerranéennes, vol. 80, no. 80, pp. 267–274.
Ningsih D. H. U., 2012, Metode Thiessen Polygon untuk Ramalan Sebaran Curah Hujan Periode Tertentu pada Wilayah yang Tidak Memiliki Data Curah Hujan, Jurnal Teknologi Informasi DINAMIK, vol. 17, no. 2, pp. 154–163.
PDAM Kabupaten Rembang, 2013, Rencana Induk Sistem Penyediaan Air Minum Kabupaten Rembang, Kabupaten Rembang.
Prawaka F., Zakaria A., and S. Tugiono, 2016, Analisis Data Curah Hujan yang Hilang Dengan Menggunakan Metode Normal Ratio, Inversed Square Distance, dan Rata-Rata Aljabar (Studi Kasus Curah Hujan Beberapa Stasiun Hujan Daerah Bandar Lampung), Jurnal Rekayasa Sipil dan Desain, vol. 4, no. 3, pp. 2303–2314.
Sosrodarsono S. and K. Takeda, 2003, Hidrologi untuk Pengairan. Jakarta: Pradnya Paramita.
Wang Z., Y. Huang, T. Liu, C. Zan, Y. Ling, and C. Guo, 2022, Analysis of the Water Demand-Supply Gap and Scarcity Index in Lower Amu Darya River Basin, Central Asia, International Journal of Environmental Research and Public Health, vol. 19, no. 2, doi: 10.3390/ijerph19020743.
Wang Z., Y. Huang, T. Liu, C. Zan, Y. Ling, and C. Guo, 2022, Analysis of the Water Demand-Supply Gap and Scarcity Index in Lower Amu Darya River Basin, Central Asia, Int J Environ Res Public Health, vol. 19, no. 2, doi: 10.3390/ijerph19020743.
Wibowo M. A., 2018, Air Baku Problem Serius Investasi Rembang.
Wilhite D. A., 2000, Chapter 1 Drought as a Natural Hazard: Concepts and Definitions Drought as a Natural Hazard: Concepts and Definitions.
Zhu K. et al., 2023, Spatio-Temporal Evolution and Propagation of Meteoro-Hydrological Drought in Yalong River Basin, Water (Basel), vol. 15, no. 6, p. 1025, doi: 10.3390/w15061025.
| Pages | 251-256 |
| Year | 2024 |
| Issue | 3 |
| Volume | 8 |
